Manage cookies that are used for advertising, such as ad personalization, remarketing, and ad effectiveness analysis.
2.19.2.1. Analyze logs in Apache Log Viewer
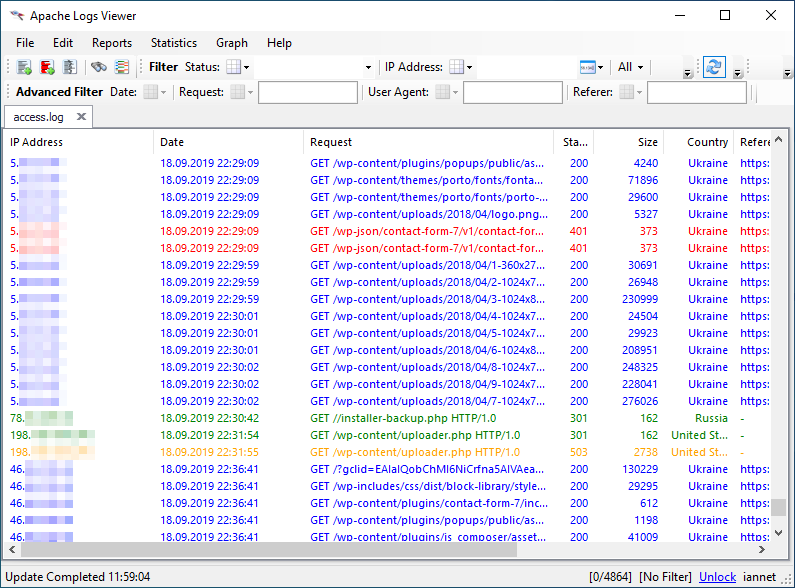
Apache Log Viewer is a program for viewing and analyzing web server logs. It is designed for Windows, but can also run on Linux and macOS using Wine. The free version offers only basic features. Advanced functionality becomes available only after purchasing a license.
To analyze logs in Apache Log Viewer, you must first download them.
Main window appearance
Menu
File
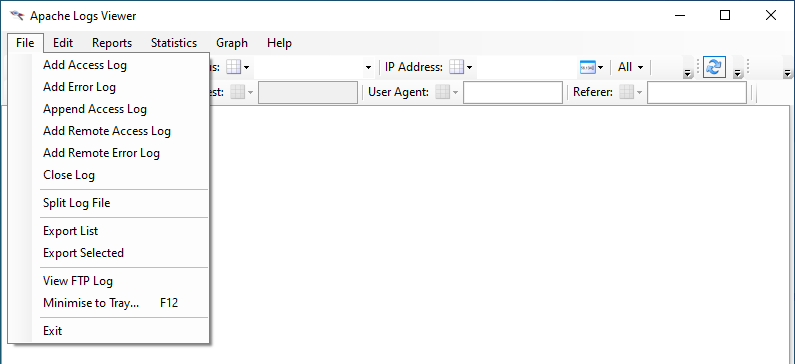
- "Add Access Log" — opens the access log. When the log opens, in the "Choose the log format" section, select "Combined". If necessary, you can also specify a specific time range.
- "Add Error Log" — opens Error Log. When the window opens, in the "Choose the log format" section, select "Apache 2.4.x". If necessary, you can also specify a specific time range.
- "Append Access Log" — appends the log to the current one. This allows you to combine multiple logs into a single log.
- "Close Log" — closes the current log.
- "Split Log File" — splitting a single large log file into several smaller ones.
- "Export List — exports the current log.
- "Export Selected" — exports the selected lines from the current log.
Edit
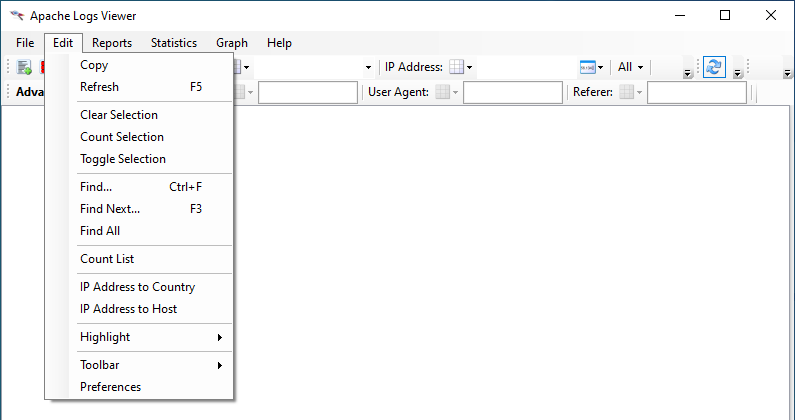
- "Clear Selection" — deselects the log entries.
- "Count Selection" — counts the number of selected log lines.
- "Toggle Selection" — inverts the selection.
- "Find" — search by request, date, IP address, Referer, and/or User-Agent.
- "Find Next" — continue the search.
- "Find All" — search for all matches.
- "Count List" — counts the total number of lines in the log.
- "IP Address to Country" — determining a country based on an IP address.
- "IP Address to Host" — identifying a host by its IP address.
- "Highlight" — highlighting data based on specific criteria:
- "Apply Highlight" — configure highlighting for specific IP addresses.
- "Clear Highlight" — disables highlighting.
- "Preferences" — program settings.
Reports
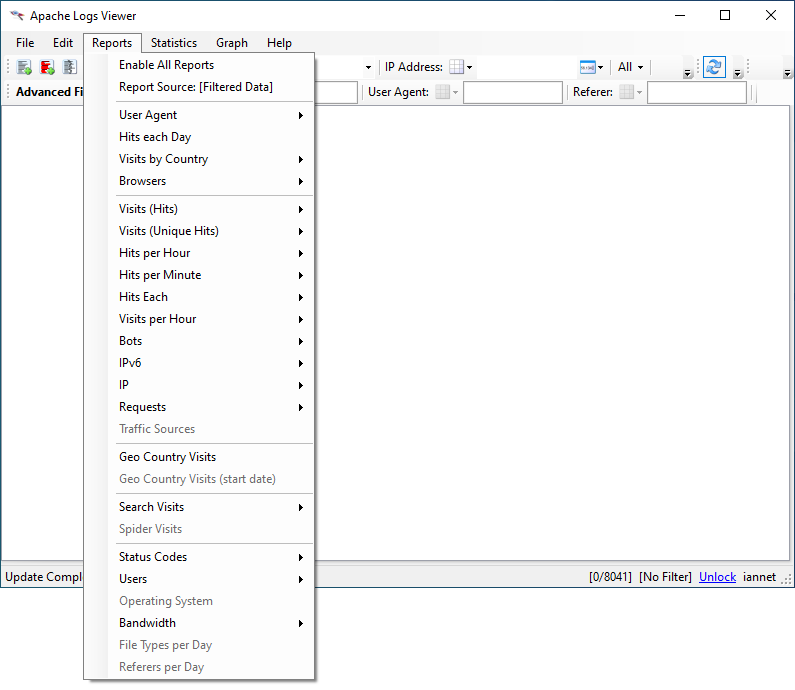
- "Report Source: [Filtered Data]" — the basis on which the report will be generated: all data from the log or only the filtered data.
- "UserAgent → UserAgent" — generating a pie chart based on visitors' User-Agent data.
- "Hits Each Day" — generating a chart based on the number of hits per day.
- "Visits by Country → Visits by Country" — generates a pie chart based on data about visitors' countries.
- "Geo Country Visits" — a world map showing the countries visited by users.
Statistics
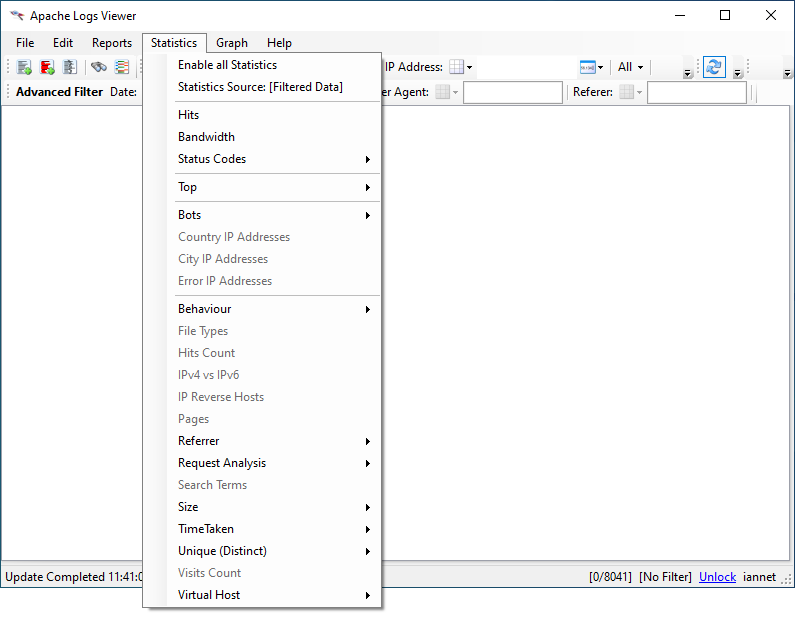
- "Statistics Source: [Filtered Data]" — the basis on which the statistics will be generated: all data from the log or only the filtered data.
- "Hits" — generating statistics on the number of hits per day.
- "Bandwidth" — tracking the amount of data transferred (in bytes) per day.
- "Top → Top 4xx Requests (URLs)" — generates statistics on pages for which the server returned a "4xx" response code, along with the number of such requests.