Manage cookies that are used for advertising, such as ad personalization, remarketing, and ad effectiveness analysis.
4.4.7. Analyze DMARC reports
Important points:
- Statistics are only collected when the domain is operational with the DMARC record added.
- In the record, only the presence of our special mailbox address in
ruaandrufis checked. - All received reports are stored without time limitation and considered when generating statistics.
- Deleting a site deletes the collected statistics of the mail domain with the same name.
- Use the DMARC report analyzer tool to analyze your own report files.
When configuring DMARC, you can specify a mailbox and criteria for sending daily reports from mail services that receive mail on behalf of your domain.
How it works
- You add a DMARC record in the domain settings with the address of a special mailbox to receive reports.
- Mail services, when they receive emails from your mail domain once a day, send a report to the mailbox from the DMARC record.
- Our system every 30 minutes checks the reports in the mailbox, analyzes them and generates illustrative statistics.
- You view statistics in a way that is easy to analyze.
Configure
The DMARC record uses
p=none instead of the recommended p=reject. This is done intentionally so that you can first test DMARC without the risk of rejecting messages from your domain. After you analyze the reports and make sure everything is working properly, you can edit the domain settings entry and replace p=none with p=reject.
- Open the "Mailboxes" section.
- In the side menu, click "DMARC reports".
- Copy the DMARC record data:
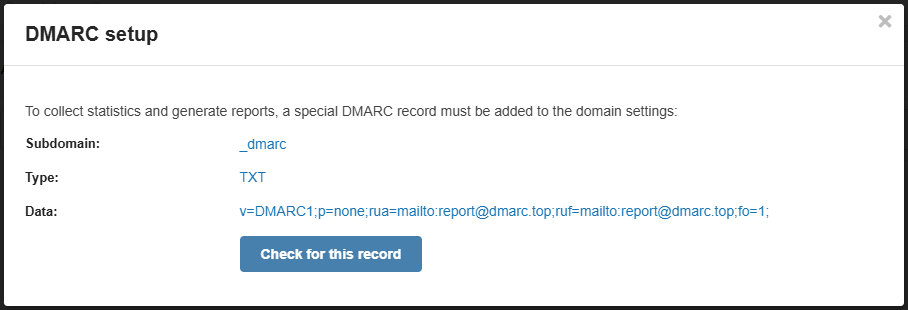
Subdomain Type Data _dmarcTXT v=DMARC1;p=none;rua=mailto:report@dmarc.top;ruf=mailto:report@dmarc.top;fo=1; - Add DNS record with this data in the domain settings.
- Once the DNS cache has been updated (usually a few hours, max 24), click "DMARC reports" again and then "Check for this record" or wait for the automatic check (performed daily at 12:00).
- Wait for statistics to be collected and generated (usually one to several days).
Statistics
Available general statistics and detailed information on individual reports.
General
The page displays general statistics based on all reports received.
Number of messages:
- Total number of messages the services have received.
- Number of messages by individual categories:
- By specific services.
- By sender PTR records.
- By domain in the "From" header.
Pie charts of SPF, DKIM and DMARC compliance by percentage.
Charts with daily statistics for the last month on SPF, DKIM and DMARC — how many messages passed validation, how many didn't, etc.
A list of received reports with information about each of them, which includes identifier, service, time range, number of messages and sources of sending messages. Each report can be viewed separately.
Example statistics: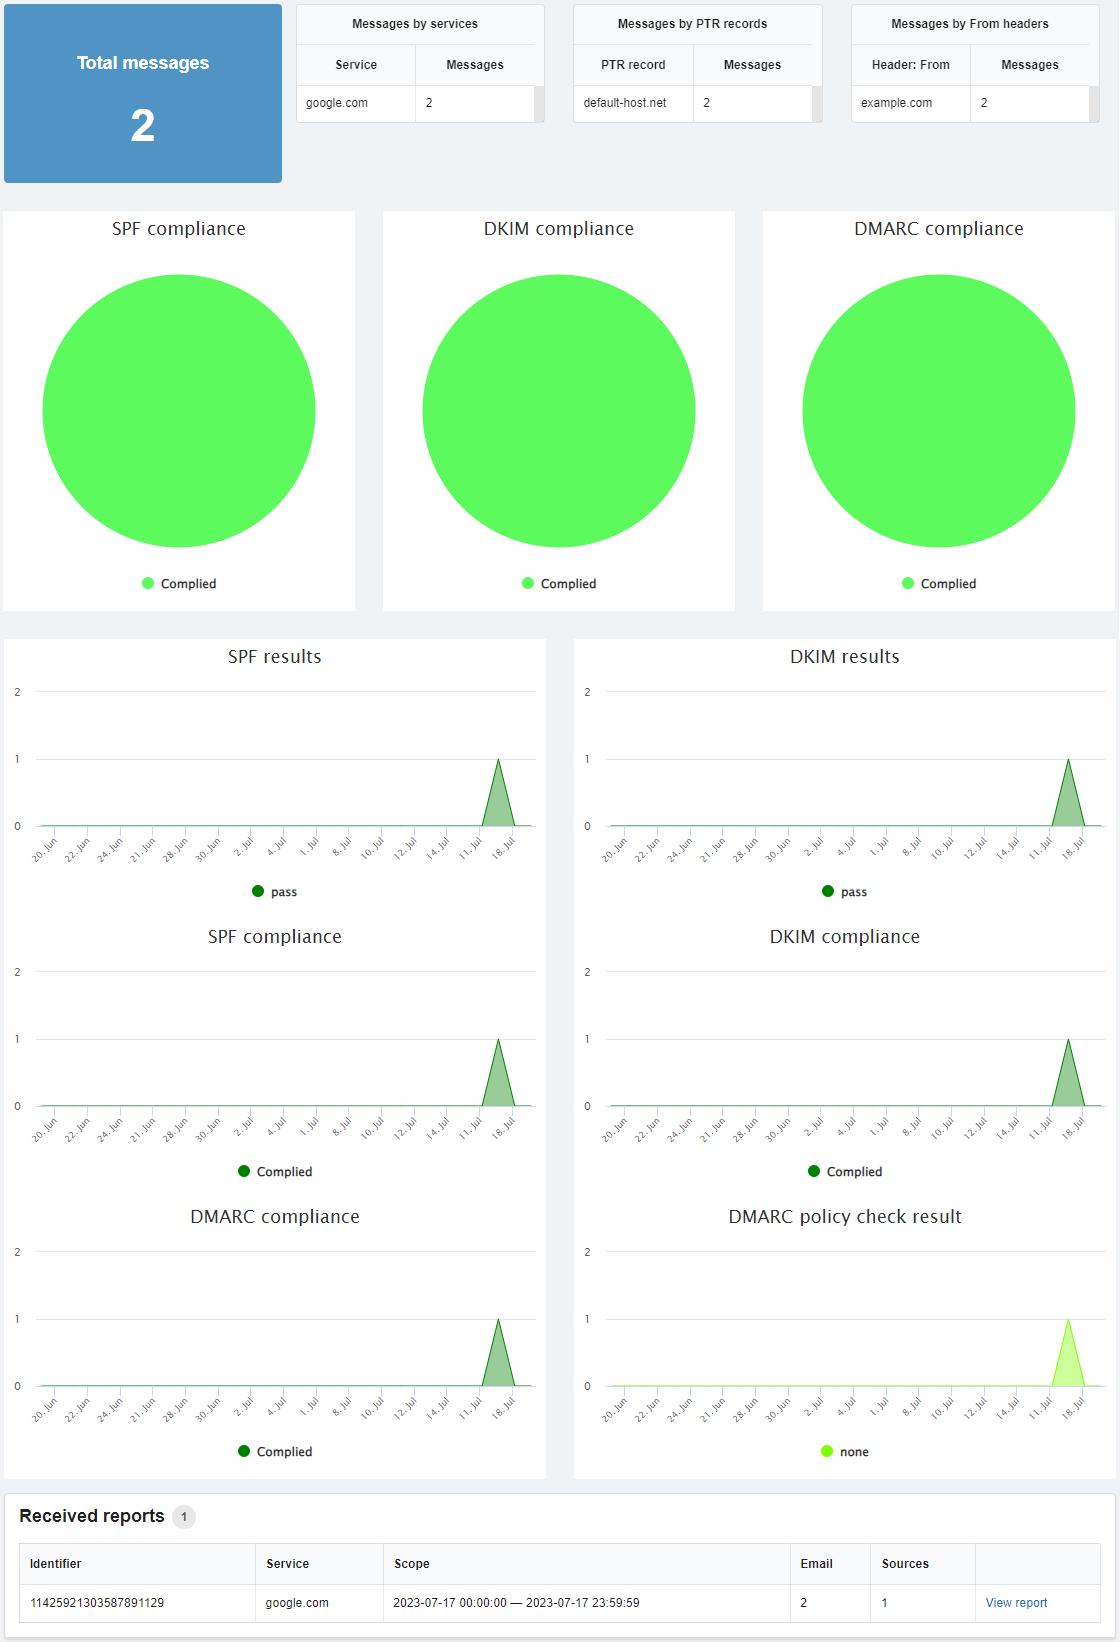
View report
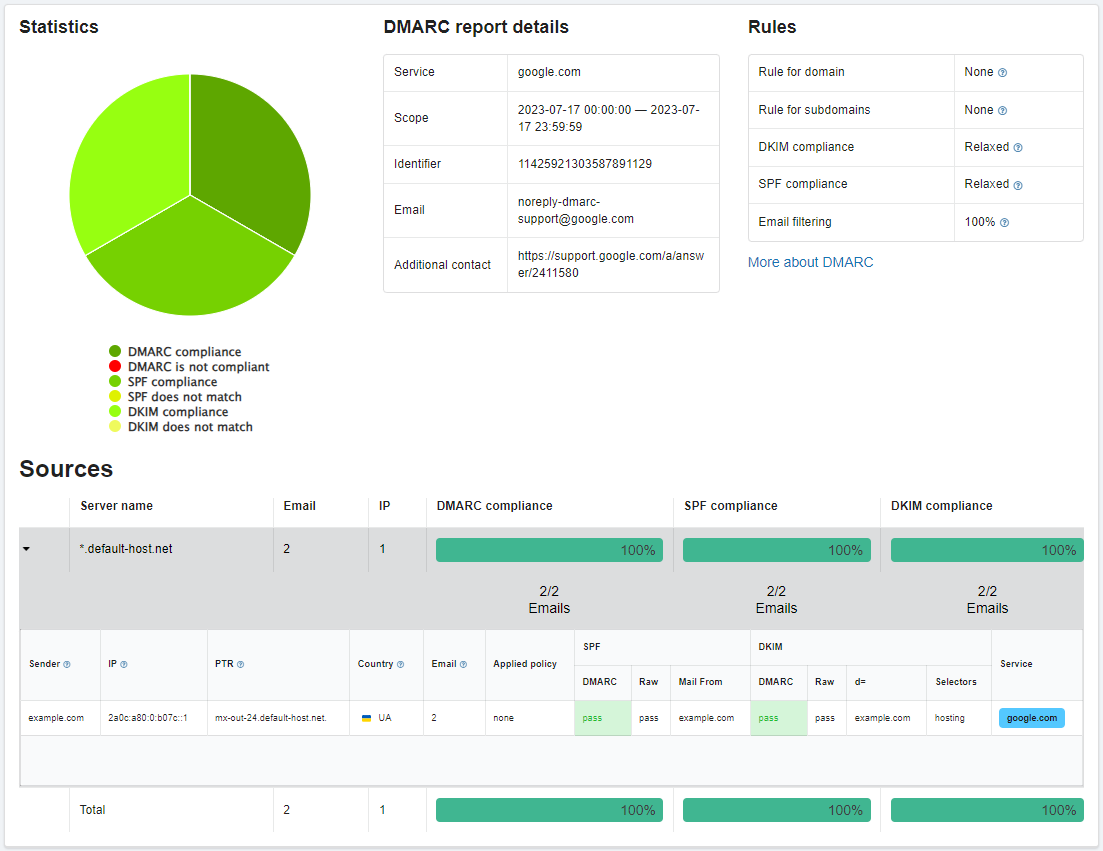
The page displays detailed information on the individual report.
Example report: