Manage cookies that are used for advertising, such as ad personalization, remarketing, and ad effectiveness analysis.
8.2.12. MySQL resource usage statistics
Attention!
If disk space is 100% full for 3 consecutive days, the instance's plan will be automatically upgraded. Before this happens, when 95% and 100% capacity is reached, corresponding notifications are sent to your email and connected messengers.
Resource usage statistics are available in the "MySQL" section on the "Statistics" tab: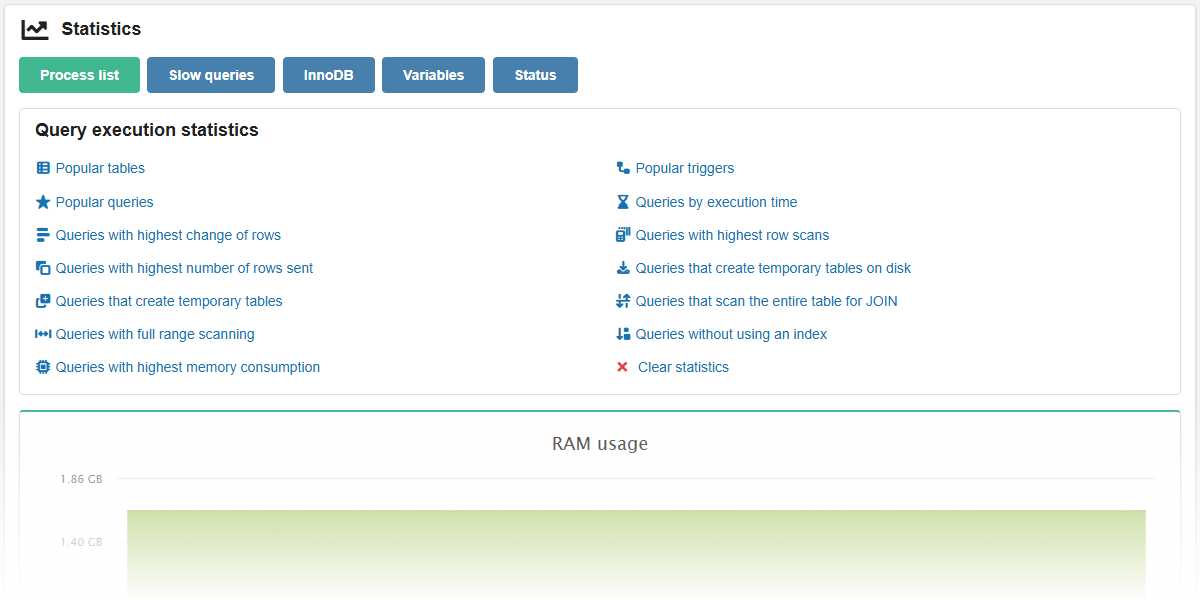
With the help of statistics you can monitor the load on the instance and determine the moment when you need to optimize databases, queries to them, upgrade the plan or configure replication.
Buttons
Process list
To view the list of active processes, click "Process list".
The list displays the active processes of all users of all databases in the instance: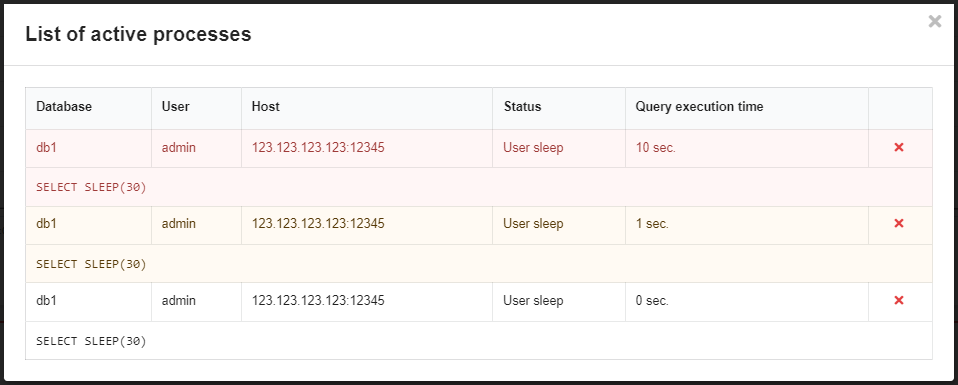
Queries that take 10 seconds or more to complete are highlighted in red, 1 second or more — in yellow. The ❌ button forcibly terminates the query.
Slow queries
Queries that take more than 5 seconds to complete are considered slow. The system automatically logs such queries so that they can be analyzed.
The "Slow queries" button opens a menu where you can:
- Download log in CSV format.
- Clear log.
A large number of slow queries can negatively affect the performance of sites that use instance databases and signal that you should consider optimizing the database, queries to it or the logic of the site scripts.
InnoDB
The "InnoDB" button displays a window with the results of the SHOW INNODB STATUS query — the main data in table form and the entire text of the query result: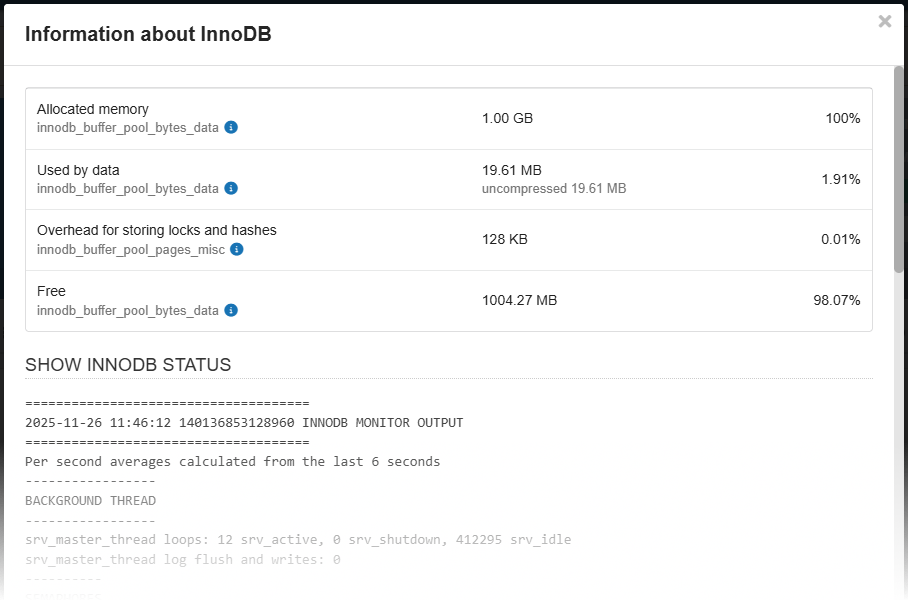
Variables
The "Variables" button displays a window with a list of all global variables and their values: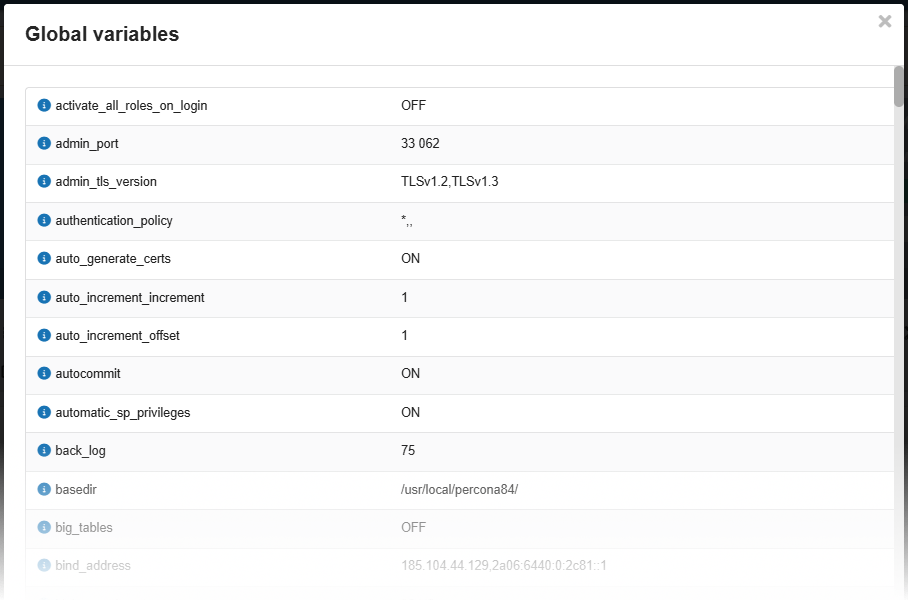
A link to the official documentation with a detailed description is available next to each variable.
Status
The "Status" button displays a window with the results of the SHOW STATUS query — a list of MySQL server status variables and their values (see official documentation):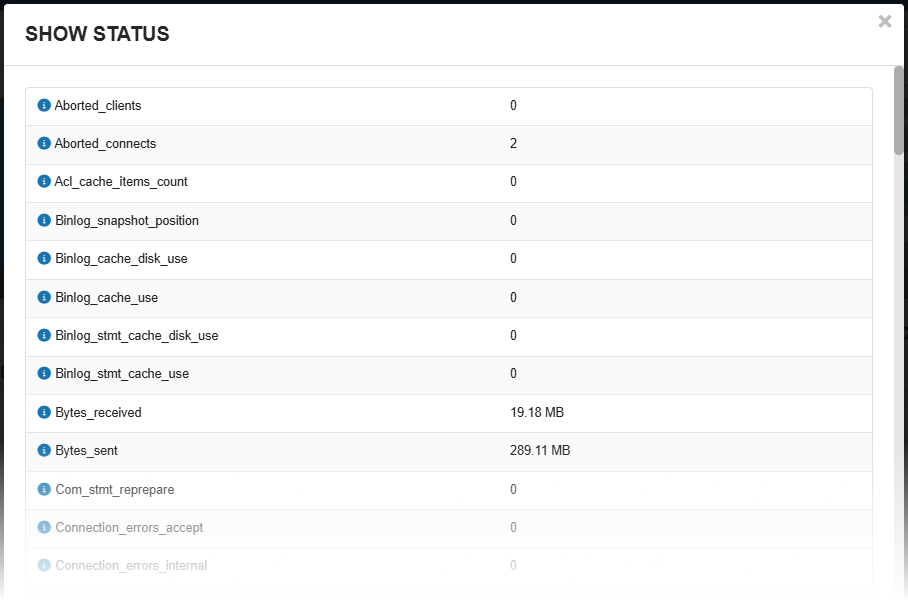
A link to the official documentation with a detailed description is available next to each variable.
Query execution statistics
Attention!
To collect and view statistics, the "performance_schema" option must be enabled in the MySQL settings.Viewing query execution statistics works based on MySQL Performance Schema and allows you to view for all databases or for a selected database the following information:
- Popular tables — a list of tables with the number of queries and wait time statistics for each of them.
- Lists of queries by various criteria with detailed information on each of them (number, average execution time, number of rows scanned, number of rows sent, maximum memory consumption, execution interval, query template and example):
- Popular queries.
- Queries with highest change of rows.
- Queries with highest number of rows sent.
- Queries that create temporary tables.
- Queries with full range scanning.
- Queries with highest memory consumption.
- Queries by execution time.
- Queries with highest row scans.
- Queries that create temporary tables on disk.
- Queries that scan entire tables for JOIN.
- Queries without index usage.
- Popular triggers — information about triggers.
Example of statistics for popular tables: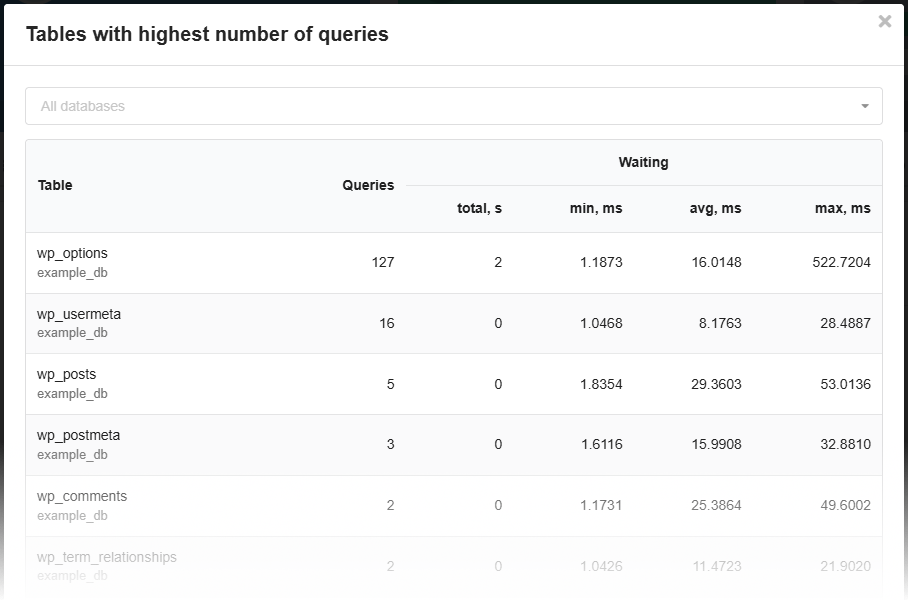
Example of statistics for popular queries: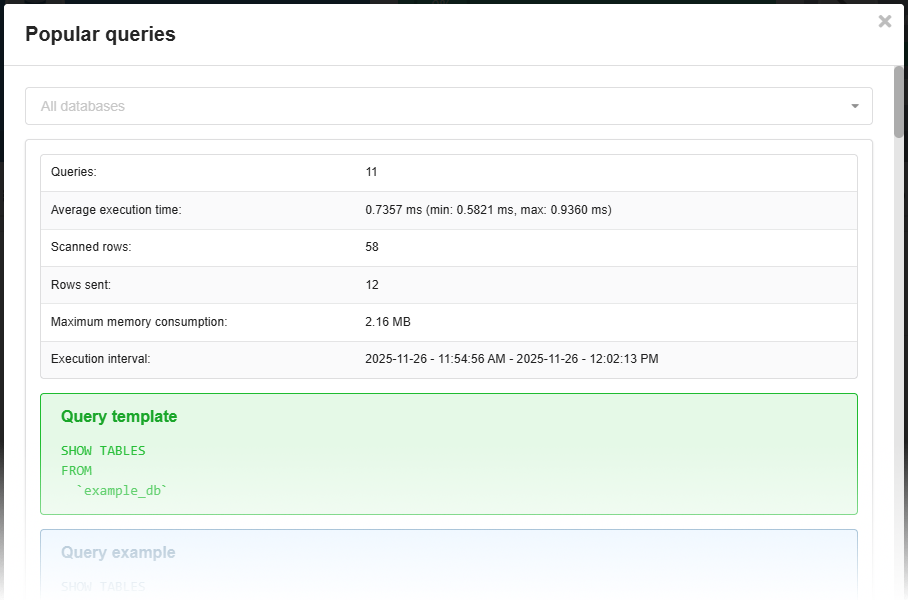
Instance
The statistics are displayed as charts showing data for the last week:
- RAM usage:
- Total memory usage — the sum of RSS and SHMEM.
- Cached files (CACHE) — the file system cache.
- Memory (RSS) — the Resident Set Size occupied by the process.
- Shared memory (SHMEM) — shared memory that is accessible to different processes.
- CPU usage — a single-core load percentage of 100 means that 1 core is being used at 100% capacity; 200 means 2 cores, and so on.
- Disk usage — the amount of disk space used by the instance's data.
- If you use 100% capacity for 3 consecutive days, the instance's plan will be automatically upgraded.