Manage cookies that are used for advertising, such as ad personalization, remarketing, and ad effectiveness analysis.
2.17.4. Web server load
Information about the load on the web server is available in the "Web server load" section.
Site rating by server load
Site rating by server load per day: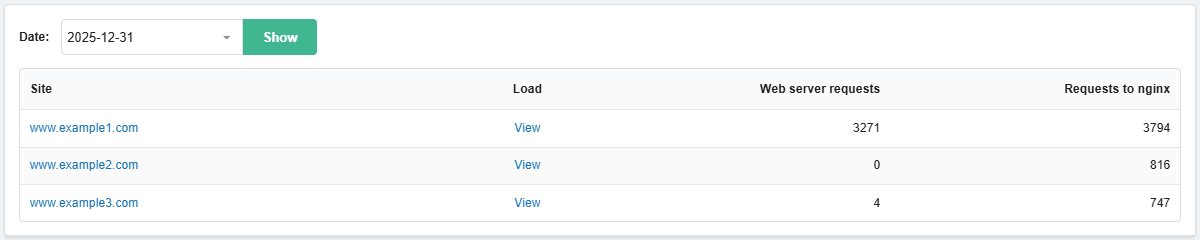
- "Date" — selection of the date for viewing statistics.
- "Site" — site name.
- "Load" — the "View" button opens request statistics for the site.
- "Requests to web server" — how many requests were processed by the selected web server. These are usually POST requests and dynamic content.
- "Requests to nginx" — how many requests were processed by the nginx server. This is the total number of requests to the site, including those sent to the web server (nginx processes requests for static content and forwards the rest to the web server for processing).
Requests to sites
Number of requests to all sites on the hosting account for the last 14 days and the last day: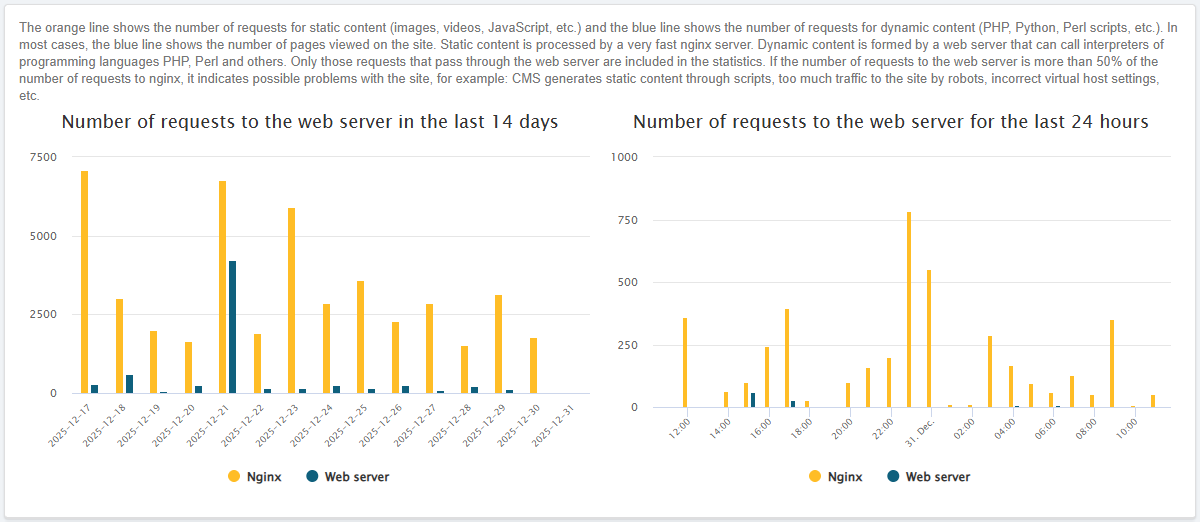
CPU time
Number of CPU minutes used by the hosting account for the last month: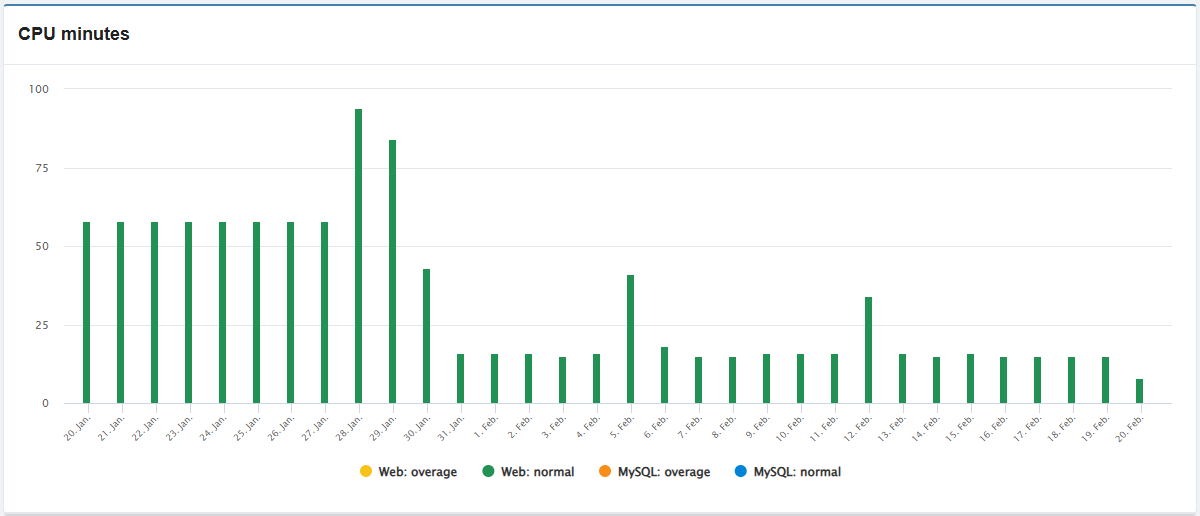
CPU
CPU load for the last 7 days: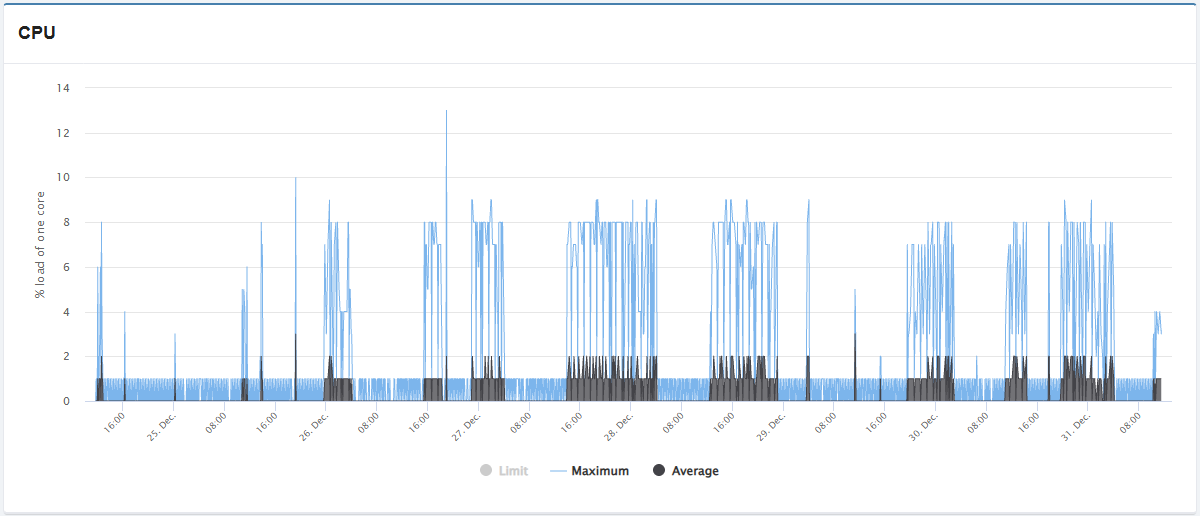
- "Limit" — CPU load limit (at low load may not be visible on the chart).
- "Maximum" — maximum CPU load.
- "Average" — average CPU load.
A single core utilization percentage of 100 means 1 core is 100% utilized, 200 means 2 cores, and so on.
RAM
RAM usage for the last 7 days:

- "Maximum" — how much maximum memory the web server used in 5 minutes.
- "Average" — how much memory the web server used on average in 5 minutes.
- Includes memory for extra services (only the actual used capacity is counted, not the entire allocated capacity).
- "Failed" — attempts to use memory by the web server over the available limit.
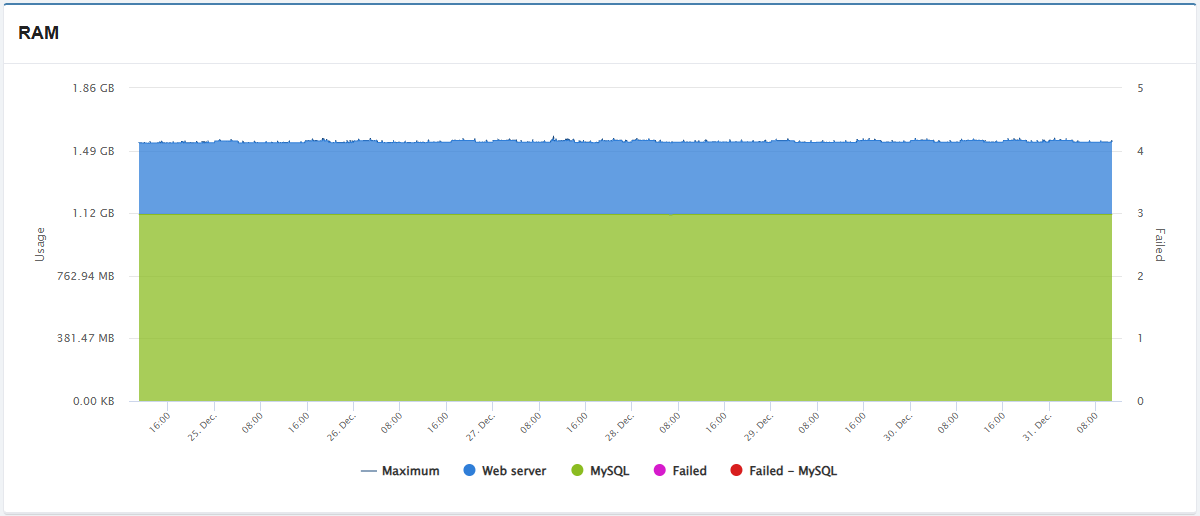
- "Maximum" — how much maximum memory the web server and MySQL-server used in 5 minutes.
- "Web server" — how much memory the web server used on average in 5 minutes.
- Includes memory for extra services (only the actual used capacity is counted, not the entire allocated capacity).
- The chart does not display from zero, but from the value "MySQL".
- "MySQL" — how much memory the MySQL server used on average in 5 minutes.
- "Failed" — attempts to use memory by the web server over the available limit.
- "Failed — MySQL" — attempts to use memory by MySQL server over the available limit.
Exceeding the limit usually causes 503 errors.
Entry processes
Number of entry processes (PHP scripts, cron jobs, and SSH sessions running at any given time) for the last 7 days: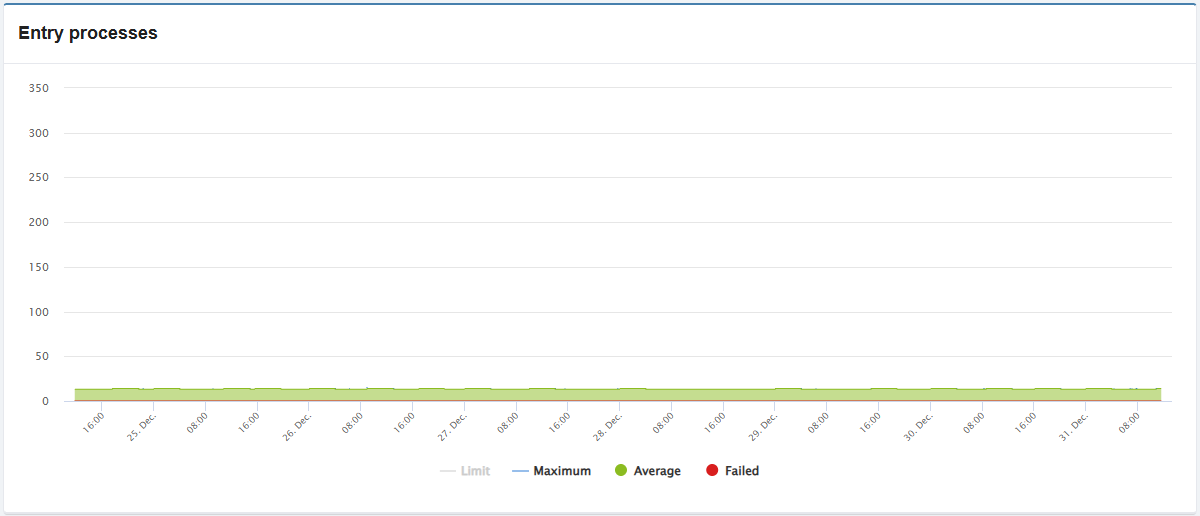
- "Limit" — limit of the number of processes (if the number of processes is small, it may not be visible on the chart).
- "Maximum" — maximum number of processes.
- "Average" — average number of processes.
- "Failed" — number of processes over the available limit.
Exceeding the limit usually causes 508 errors. Common reasons: active work of scripts, high traffic (real visitors, active indexing by search engines, requests from bad bots, DDoS attack), many loaded sites in the hosting account, sites using too many plugins, poorly written scripts, etc.
(4)