Manage cookies that are used for advertising, such as ad personalization, remarketing, and ad effectiveness analysis.
2.17.3. Server resources consumption charts
Charts are displayed at the bottom of the "Hosting" section.
Buttons below the charts:
- "Customize charts" — enable/disable required charts and change their order.
- "Update charts" — update information on all charts.
Exceeding the available limits can have various consequences.
CPU
CPU load chart for the last 7 days: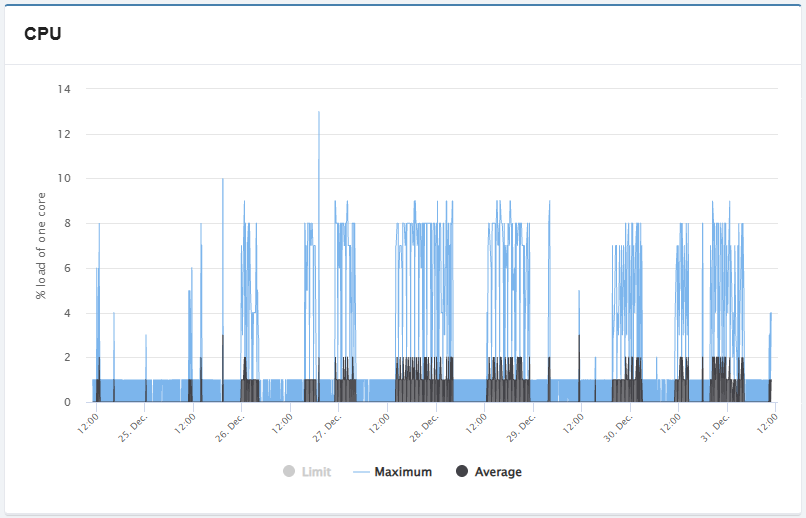
- "Limit" — CPU load limit (at low load may not be visible on the chart).
- "Maximum" — maximum CPU load.
- "Average" — average CPU load.
A single core utilization percentage of 100 means 1 core is 100% utilized, 200 means 2 cores, and so on.
RAM
RAM usage chart for the last 7 days:
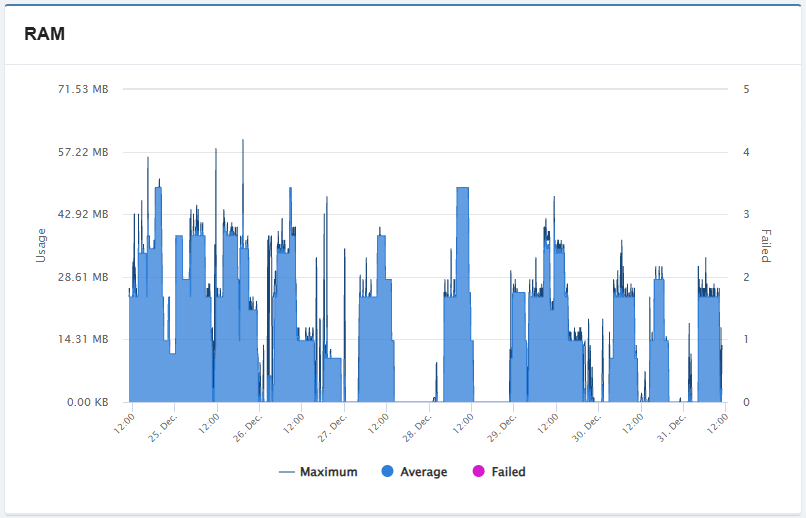
- "Maximum" — how much maximum memory the web server used in 5 minutes.
- "Average" — how much memory the web server used on average in 5 minutes.
- Includes memory for extra services (only the actual used capacity is counted, not the entire allocated capacity).
- "Failed" — attempts to use memory by the web server over the available limit.
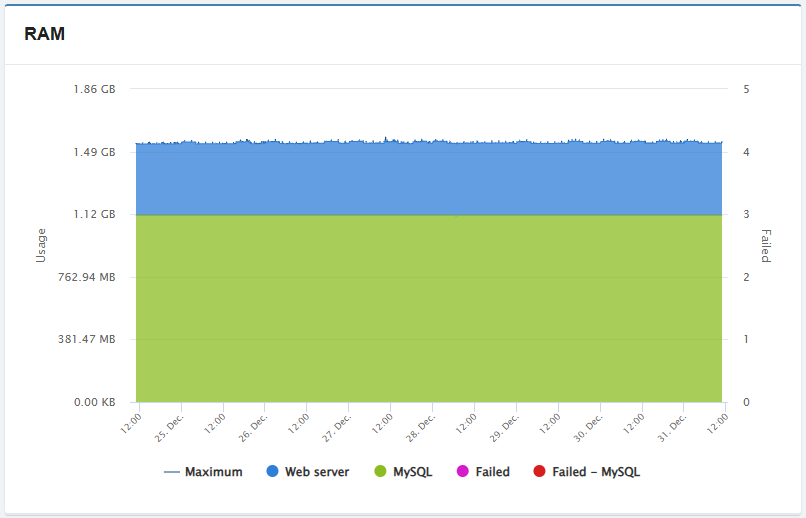
- "Maximum" — how much maximum memory the web server and MySQL-server used in 5 minutes.
- "Web server" — how much memory the web server used on average in 5 minutes.
- Includes memory for extra services (only the actual used capacity is counted, not the entire allocated capacity).
- The chart does not display from zero, but from the value "MySQL".
- "MySQL" — how much memory the MySQL server used on average in 5 minutes.
- "Failed" — attempts to use memory by the web server over the available limit.
- "Failed — MySQL" — attempts to use memory by MySQL server over the available limit.
Exceeding the limit usually causes 503 errors.
Entry processes
Chart of the number of entry processes (PHP scripts, cron jobs, and SSH sessions running at any given moment) for the last 7 days: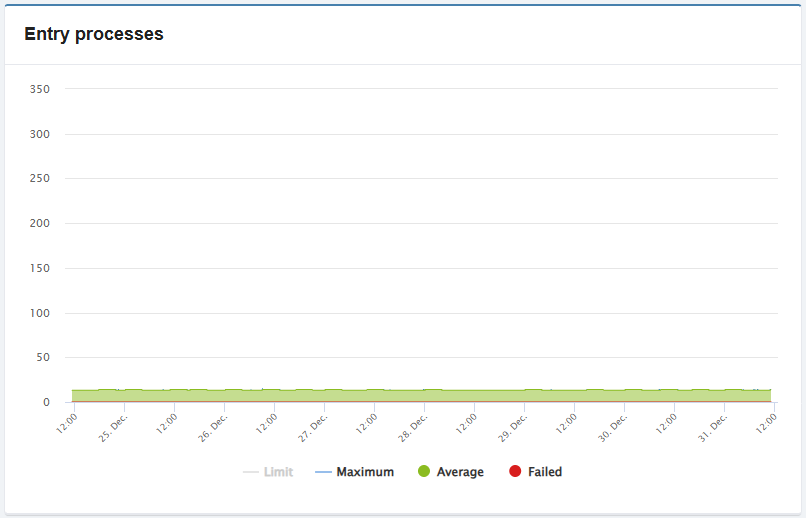
- "Limit" — limit of the number of processes (if the number of processes is small, it may not be visible on the chart).
- "Maximum" — maximum number of processes.
- "Average" — average number of processes.
- "Failed" — number of processes over the available limit.
Exceeding the limit usually causes 508 errors. Common reasons: active work of scripts, high traffic (real visitors, active indexing by search engines, requests from bad bots, DDoS attack), many loaded sites in the hosting account, sites using too many plugins, poorly written scripts, etc.
CPU minutes
Chart of CPU minutes consumption for the last month: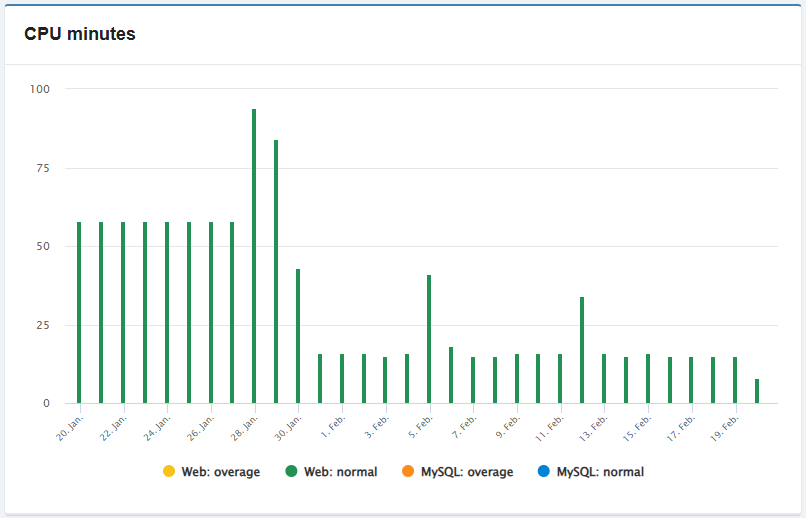
- "Web" — web server:
- "overage" — consumption of CPU minutes in excess of the norm (more than 100 CPU minutes per day).
- "normal" — CPU minutes consumption within the normal range (up to 100 CPU minutes per day).
- "MySQL" — MySQL server:
- "overage" — consumption of CPU minutes in excess of the norm (more than 100 CPU minutes per day).
- "normal" — CPU minutes consumption within the normal range (up to 100 CPU minutes per day).
IO
By default, the chart is disabled. It is enabled using the chart settings button at the bottom of the page.
Chart of the number of disk subsystem I/O operations for the last 7 days: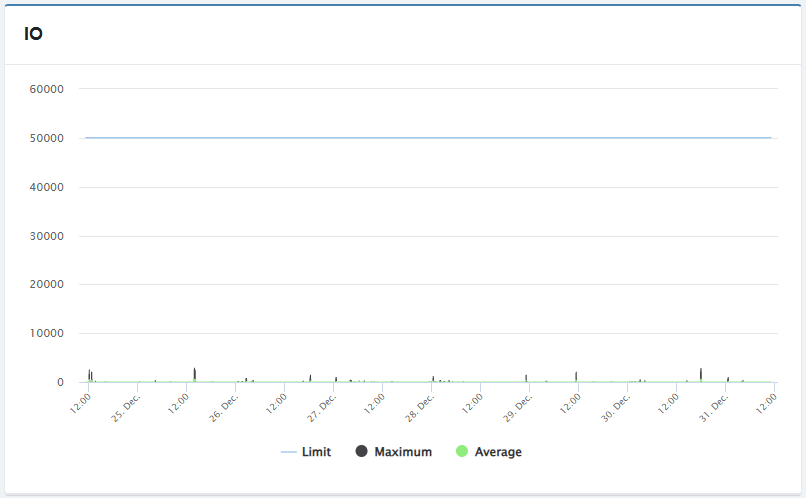
- "Limit" — limit of the number of operations.
- "Maximum" — maximum number of operations.
- "Average" — average number of operations.
Web server requests
By default, the chart is disabled. It is enabled using the chart settings button at the bottom of the page.
Chart of number of requests to Apache and nginx web server and number of requests from Google for the last 24 hours: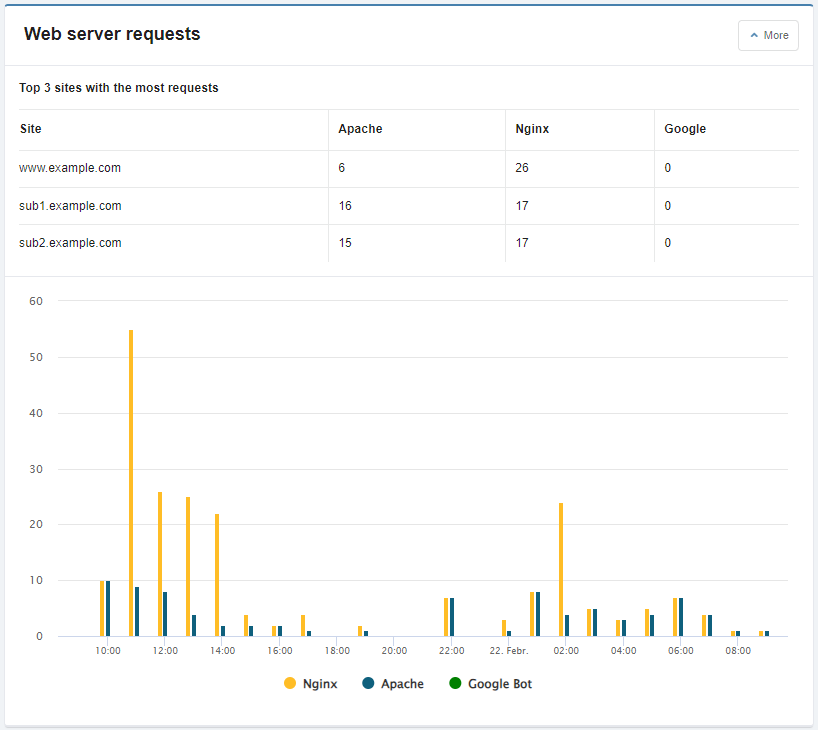
The "More" button expands/collapses the list of top 3 sites that create load on the server.
Database queries
By default, the chart is disabled. It is enabled using the chart settings button at the bottom of the page.
Chart of the number of queries to databases for the last month: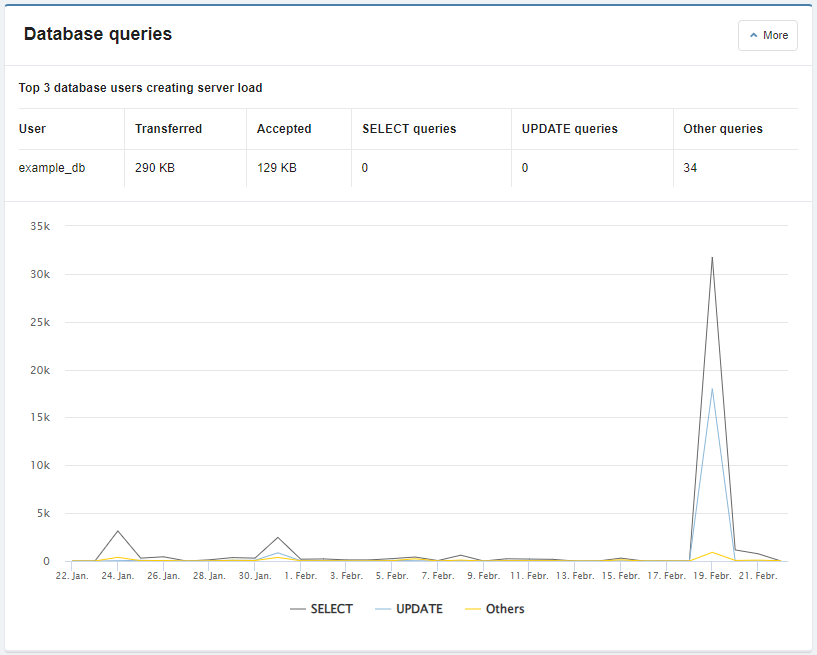
The "More" button expands/collapses the list of the top 3 database users that create load on the server.
Number of processes
By default, the chart is disabled. It is enabled using the chart settings button at the bottom of the page.
Chart is similar to Entry processes, but includes all processes of the hosting account for the last 7 days: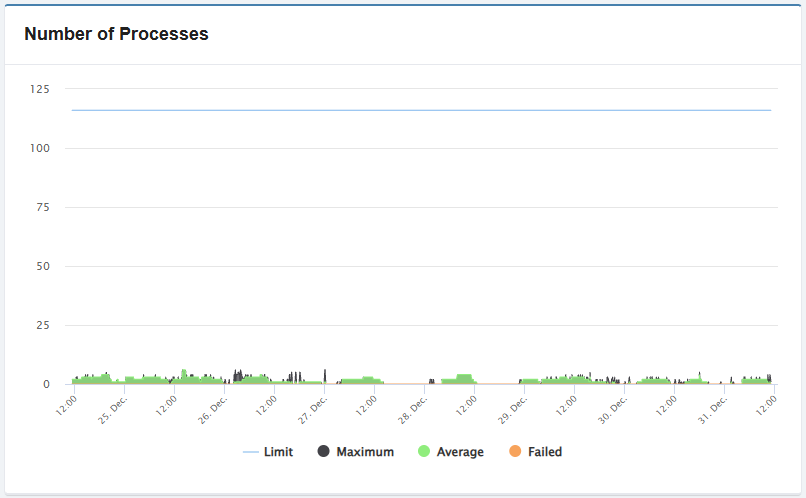
- "Limit" — limit of the number of processes (if the number of processes is small, it may not be visible on the chart).
- "Maximum" — maximum number of processes.
- "Average" — average number of processes.
- "Failed" — number of processes over the available limit.
Consequences of high load
It is important to keep in mind that there are server resource consumption limits for both shared hosting and business hosting. But if shared hosting has such a limitation as CPU minute, then business hosting has no such limitation, but there are still limitations, which are conditioned by the provided server resources corresponding to the plan used.
When the CPU and RAM resource consumption charts show high values, this consumption can lead to problems in the operation of all the sites of the hosting account and it is worthwhile to immediately start looking for ways to fix the problem.
The main problems that can be observed with high resource consumption:
- Slowdown of site scripts and slow loading of pages.
- Errors on the site due to long waiting times or inability to perform a particular process.
- Errors 500 (see Number of processes).
- Errors 508 (see Entry processes).
To resolve the problem, you can use the recommendations in the instructions for eliminating the load created.
(21)
Comments
Чи було вирішено ваше питання після звернення до онлайн чату?
Ми не впливаємо на споживання ресурсів процесами ваших сайтів. Рекомендуємо проаналізувати логи сайтів та скористатись профілюванням, щоб з’ясувати, що саме викликає пікові навантаження. Це можуть бути природні стрибки активності через рекламу, підвищену відвідуваність, дії в адміністративній панелі (наприклад, імпорт товарів, оновлення даних) або ж можливі ознаки шкідливої діяльності. Аналіз цих факторів допоможе знайти оптимальне рішення та мінімізувати подальші проблеми.
Профілювання не дає ефекту і працює некоректно. В моєму випадку, звіт не формувався жодного разу. Переглянути його я не зміг.
З'єднання по SHH також не дає результату
З'єднання по Puuty не працює коректно
Продіагнозтувати проблему майже не вдається
Перевірка вбудованим антивірусом в панелі керування не локалізує проблему. Можливо, це пожа межами його можливостей.
Отримую повідомлення про перевищення навантаження останні кілька місяців. Проблема не усунена й досі
Доводиться моніторити постійно. А хост-акк перевели на укр сервер, відповідно до відповіді техпідтримки
Якщо у вас виникають труднощі з підключенням через SSH або використанням PuTTY, будь ласка, зверніться до онлайн-чату та надайте детальну інформацію про суть проблеми для швидшого вирішення.
Щодо профілювання: якщо у вас виникають складнощі з його використанням або є сумніви у правильності роботи інструменту, будь ласка, також зверніться в онлайн-чат для консультації та допомоги.
Звертаємо вашу увагу: вбудований антивірус у панелі керування допомагає лише виявляти відомі шкідливі програми. Він не впливає на загальне навантаження сайту та не допомагає у діагностиці проблем із перевищенням ресурсів. Тому використовувати його для пошуку причин високого навантаження немає сенсу.
Компания дорожит своей репутацией и не занимается фальсификациями в погоне за сиюминутной выгодой. В том, что информация о нагрузке реальная, а не вымышленная, легко убедиться, просто комплексно проверив статистику и сопоставив её с логами доступа к сайтам.
> У меня есть сайты которые не менялись годами и о вдруг какие то перерасходы.
Отсутствие изменений на сайтах не означает, что они не могут создавать нагрузку при всплесках запросов.
> Я думаю что или то что я говорю, или какие то атаки на сайт или хостинг потому что то 3-4 величина то 443 пиково, ну так же не бывает что с ничего вдруг такая загрузка.
Например, прямо сейчас вы можете открыть страницу нагрузки на веб-сервер своего хостинг-аккаунта — https://adm.tools/hosting/account/0/serverload/. На странице будет рейтинг сайтов по нагрузке на сервер. В рейтинге видно, что на один из ваших сайтов поступает намного больше запросов, чем на остальные. Если проверить логи этого сайта, можно увидеть, что больше половины запросов к нему отправляется с одного IP. В этих запросах явно видно попытки перебора разных файлов на сайте.
На каждый такой запрос скрипты сайта генерируют страницу с ошибкой 404. Генерация каждой такой страницы потребляет ресурсы, что в итоге приводит к росту нагрузки и быстрому исчерпанию процессорных минут. Конкретно в этом случае, можно запретить доступ к сайту для этого IP, добавив его в чёрный список. Либо можно включить в панели управления защиту от флуда I'm Under Attack.
Это лишь один из наглядных примеров, который демонстрирует, что проблема связана не с хостингом, а с запросами на конкретный сайт.