Manage cookies that are used for advertising, such as ad personalization, remarketing, and ad effectiveness analysis.
2.4.1.3.2. Request statistics
You can view the statistics in the "Request statistics" section.
Number of requests
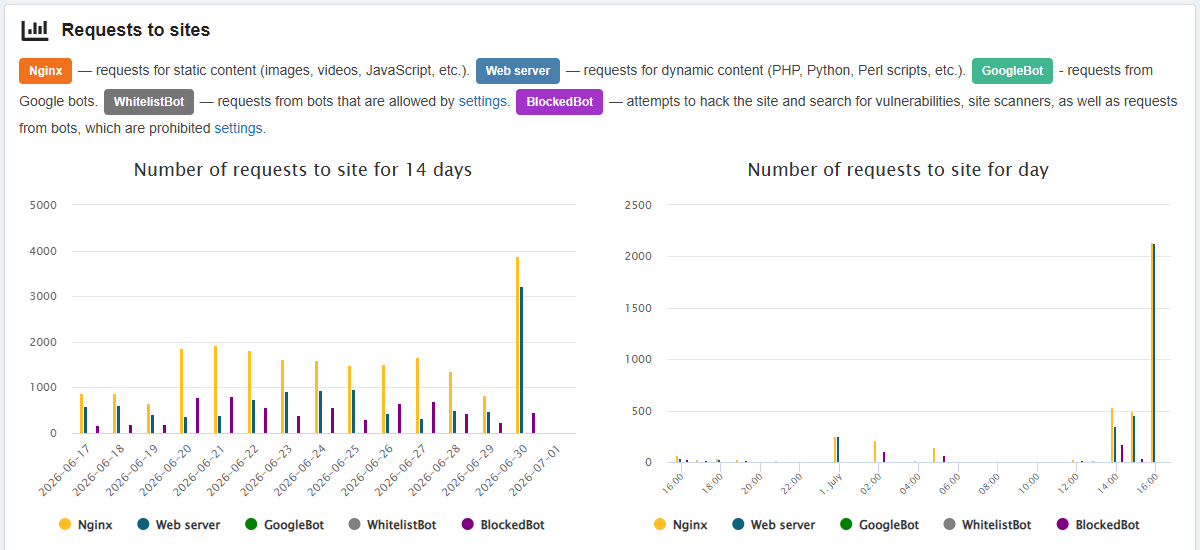
The "Number of requests to site" charts show how many requests of various types the site has received over the past 14 days and the past 24 hours:
- Nginx — requests for static content (styles, JavaScript, images, videos, etc.).
- Web server — requests for dynamic content (PHP, Python, Perl scripts, etc.).
- GoogleBot — requests from Google bots.
- WhitelistBot — requests from bots that are allowed by bot protection.
- BlockedBot — attempts to hack the site and search for vulnerabilities, site scanners, as well as requests from bots that are prohibited by bot protection.
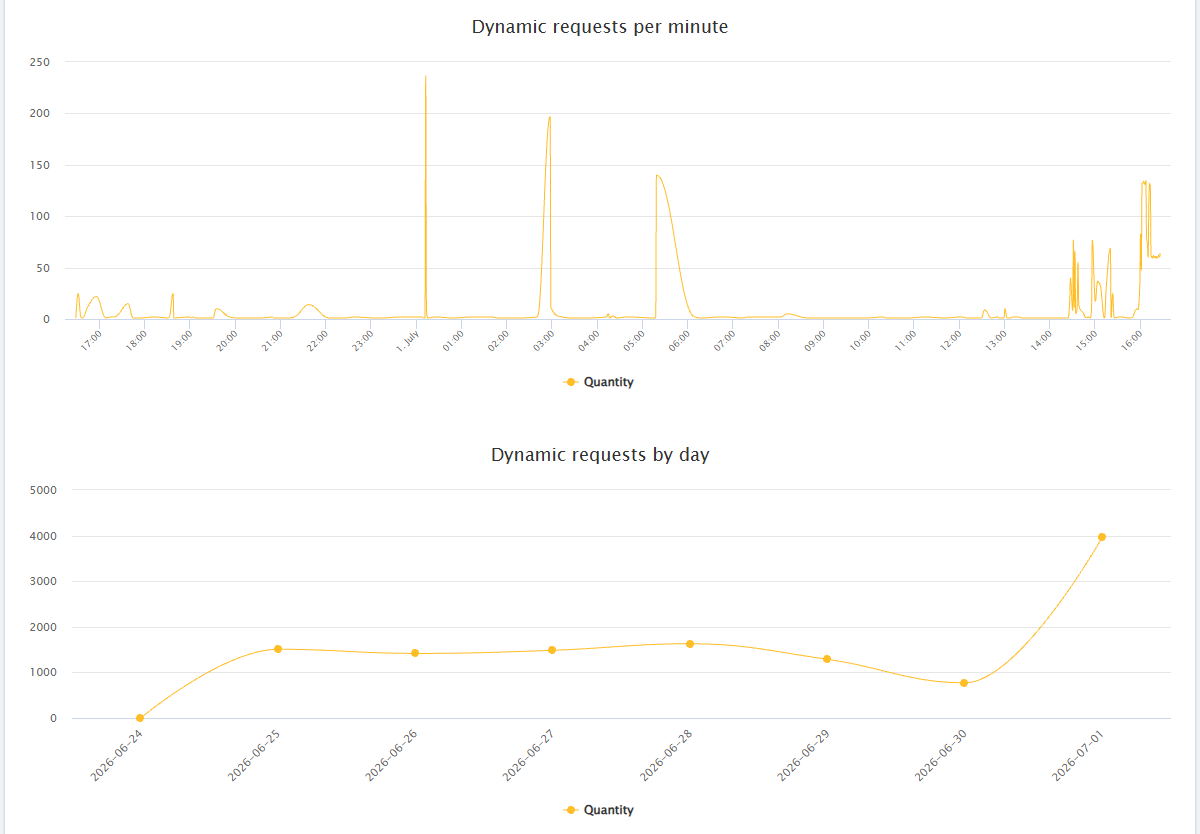
Dynamic requests
The "Dynamic requests" charts show how many requests the nginx server forwarded to the web server for processing each minute and by day (in other words, how many requests were addressed directly to the site's scripts).
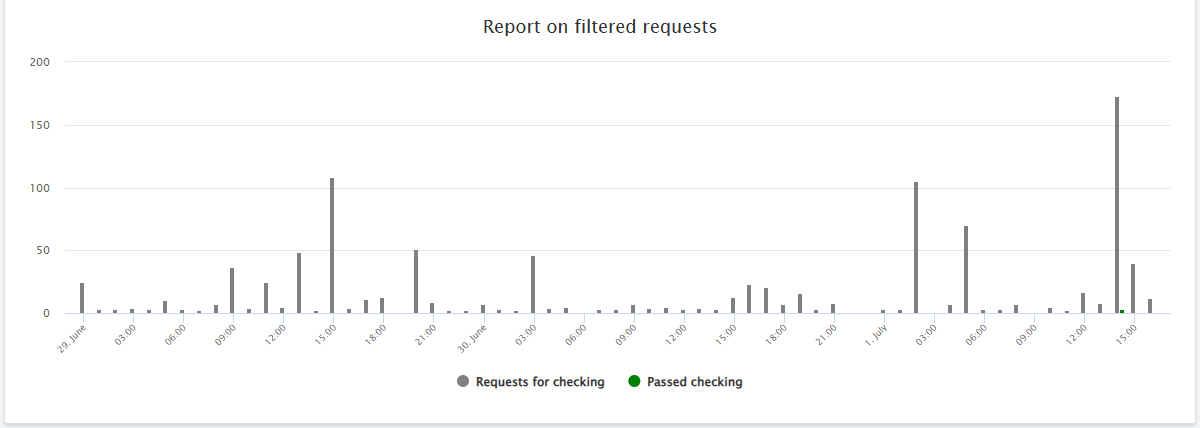
Filtered requests
The "Report on filtered requests" chart shows how many requests reached the hosting security page and how many of them successfully passed the check.
A "security page" refers to a page where a sum is calculated or a JS/Captcha is checked, which is displayed depending on the settings of the security measures in use:
(1)