Manage cookies that are used for advertising, such as ad personalization, remarketing, and ad effectiveness analysis.
2.8.23. PHP profiling
General information
Profiling is the collection of detailed information about the execution time of script functions and RAM consumption during the processing of a request to the site. With this information, the site developer can identify the slowest parts of the code in order to optimize them and reduce the execution time of scripts.
What profiling can reveal:
- What functions were performed and how many times during the script's execution.
- How long each function took to execute.
- How much RAM was used by the function and peak consumption values.
Procedure
Profiler
The XHProf extension is used for profiling.
Important points:
- The profiler can be enabled for sites with PHP versions 7.0-8.5.
- While the profiler is running, the open_basedir parameter is automatically disabled.
- Profiler reports are stored in the disk space of the hosting account and take up space and inodes.
Working with the profiler is performed in the "PHP profiling" section.
Enable
Notes:
- When enabled in
php.ini, the extension is connected and a directive of the formauto_prepend_file = "/home/{$login}/.system/profiler/profiler_{$host_id}.php"is added to launch the profiler. - The directive is added separately and does not affect previously added
auto_prepend_file. - Activation occurs not instantly — there is a slight delay of several minutes, which is necessary for the changes to the PHP settings to take effect.
Select the desired time in the "PHP profiling" block and click "Enable profiler":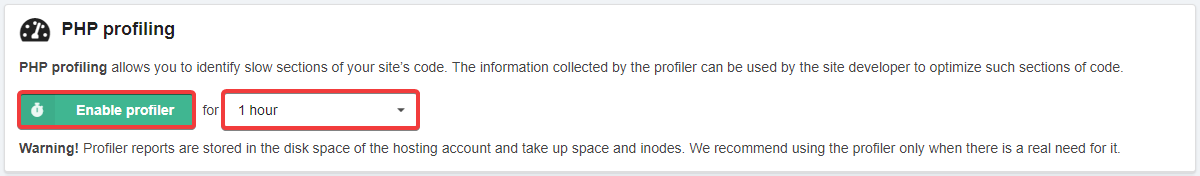
IP list
Add to the list of IP addresses from which the profiler will be launched: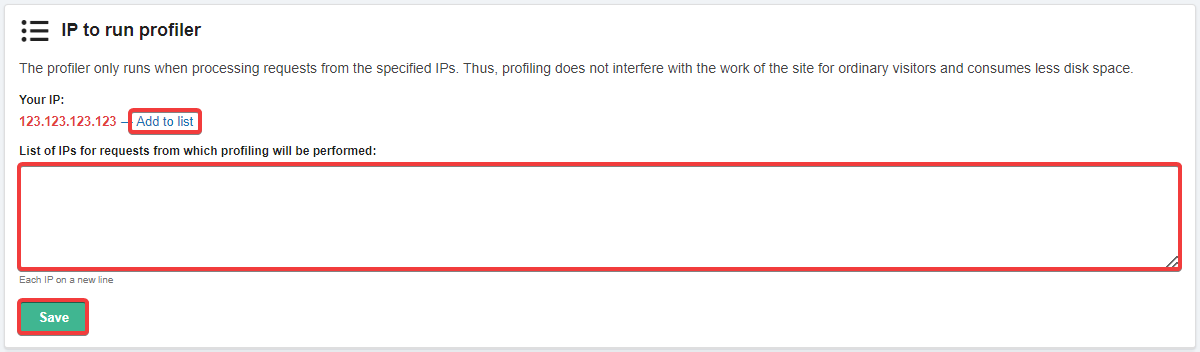
Reports
Notes:
- The report list is displayed from newest to oldest.
- Report files are stored in the
.system/profilerdirectory in the root directory of the hosting account. - Reports can only be deleted manually. This means that they remain available for analysis after the profiler has been disabled.
All results of the profiler's work are displayed in the "Profiler reports" block: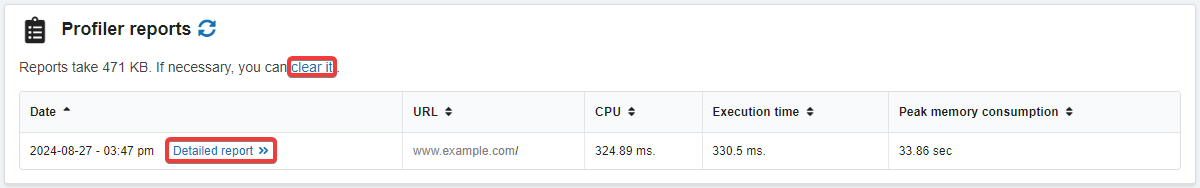
The block displays the current capacity that existing reports occupy on the disk. Here, you can also delete all reports using the "clear" button.
List columns:
- "Date" — date and time of request processing.
- "URL" — URL of the request.
- "CPU" — the time the processor spends processing a request.
- "Execution time" — the time taken by the script to process the request.
- "Peak memory consumption" — maximum memory consumption when processing a request.
The "Detailed report" button opens detailed information about the script's operation when processing the request: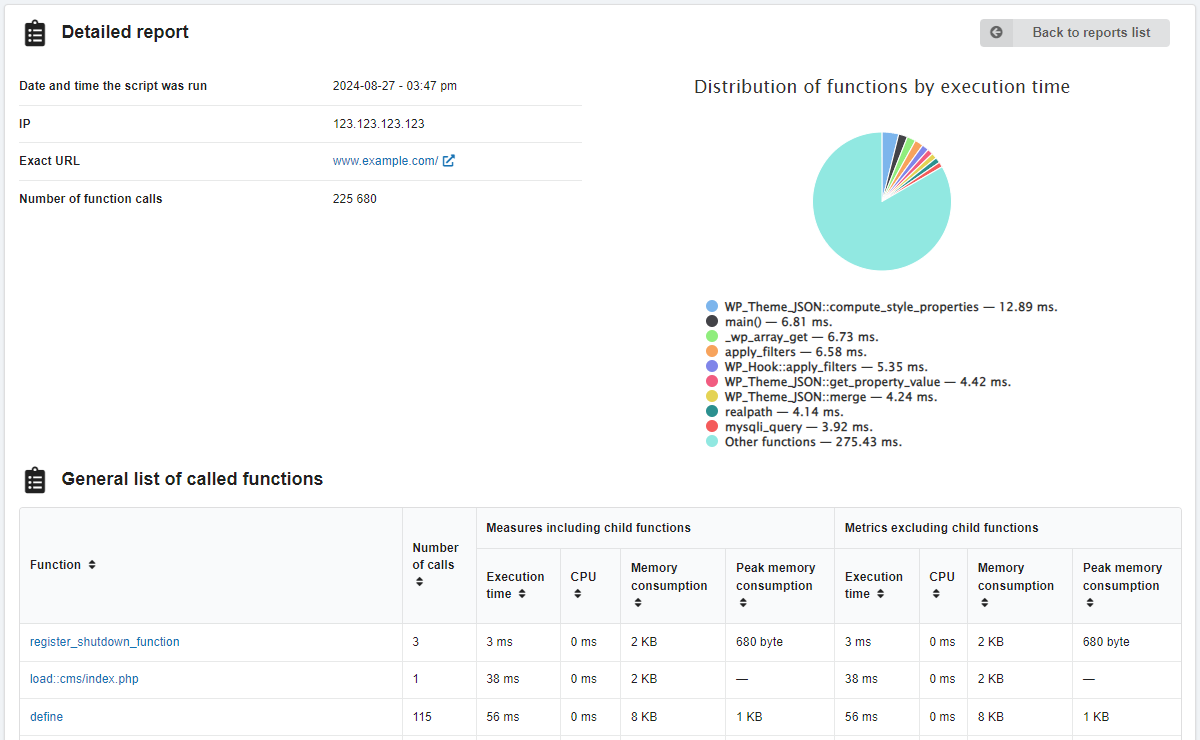
In the detailed report:
- "Date and time the script was run".
- "IP" — the IP address from which the request originated.
- "Exact URL" — the URL that was requested.
- "Number of function calls" — the number of functions executed by the script when processing the request.
- "Distribution of functions by execution time" — a graph showing the proportion of time spent on different functions in relation to the total time spent.
Columns of the general list of called functions:
- "Function" — the name of the function.
- "Number of calls" — how many times the function was executed.
- "Measures including child functions":
- "Execution time" — how long it took to execute the function.
- "CPU" — how much time the processor spent performing the function.
- "Memory consumption" — how much memory was used during the execution of the function.
- "Peak memory consumption" — the peak value of memory usage when performing a function.
- "Metrics excluding child functions" — similar to the indicators above, but excluding child functions.
A dash indicates that the profiler was unable to accurately calculate the value of the metric.
Clicking on the function name opens a detailed report on that function: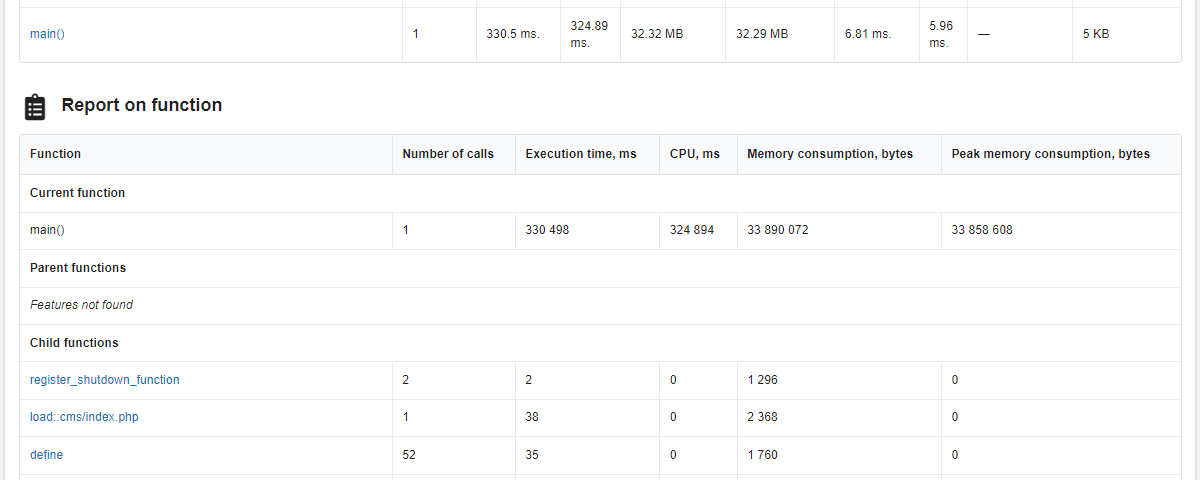
Report columns by function:
- "Function" — the name of the function.
- "Number of calls" — how many times the function was executed.
- "Execution time, ms" — how long it took to execute the function.
- "CPU, ms" — how long the processor was busy performing the function.
- "Memory consumption, bytes" — how much memory was used during the execution of the function.
- "Peak memory consumption, bytes" — the peak value of memory usage when executing the function.
The functions in the list are divided into three groups:
- "Current function" — the function for which information is currently open.
- "Parent functions" — functions from which the current function was called.
- "Child functions" — functions that were called from the current function.
By clicking on the names of parent/child functions, you can navigate through the hierarchy of all called functions and view information about each of them.
Disable
Click "Disable profiler" in the "PHP profiling" block or wait for the automatic disable time: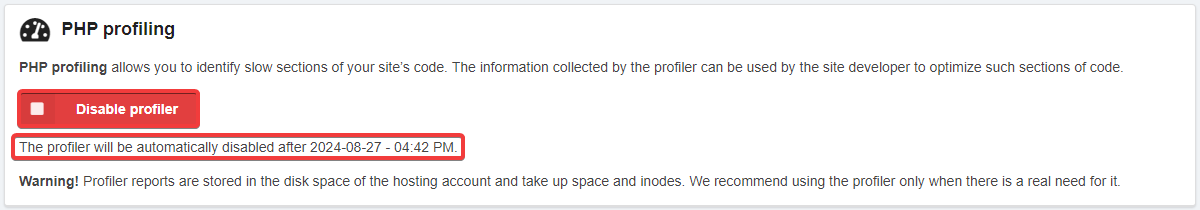
(2)
Comments