Manage cookies that are used for advertising, such as ad personalization, remarketing, and ad effectiveness analysis.
5.19. VPS usage statistics
In the "VPS" section on the "Statistics" tab you can see the statistics of resources and traffic usage.
Resources
Why available RAM may not match the amount in your plan
The amount of available RAM may be affected by the settings of the OS you are using. For example, on Ubuntu 26.04 LTS, plans with 2-4 GB of RAM will have 320 MB less available due to the OS's own settings for storingkdump (by default, around 15% of the total RAM is allocated): crashkernel=2G-4G:320M,4G-32G:512M,32G-64G:1024M,64G-128G:2048M,128G-:4096M. To check the situation, the easiest way is to run the command cat /proc/cmdline — if the amount of available RAM is clearly less than the amount specified in your plan and the command output includes crashkernel, then that is the cause. crashkernel can usually be configured or disabled in the GRUB config /etc/default/grub or via a separate config in /etc/default/grub.d/ (the procedure depends on the used OS).
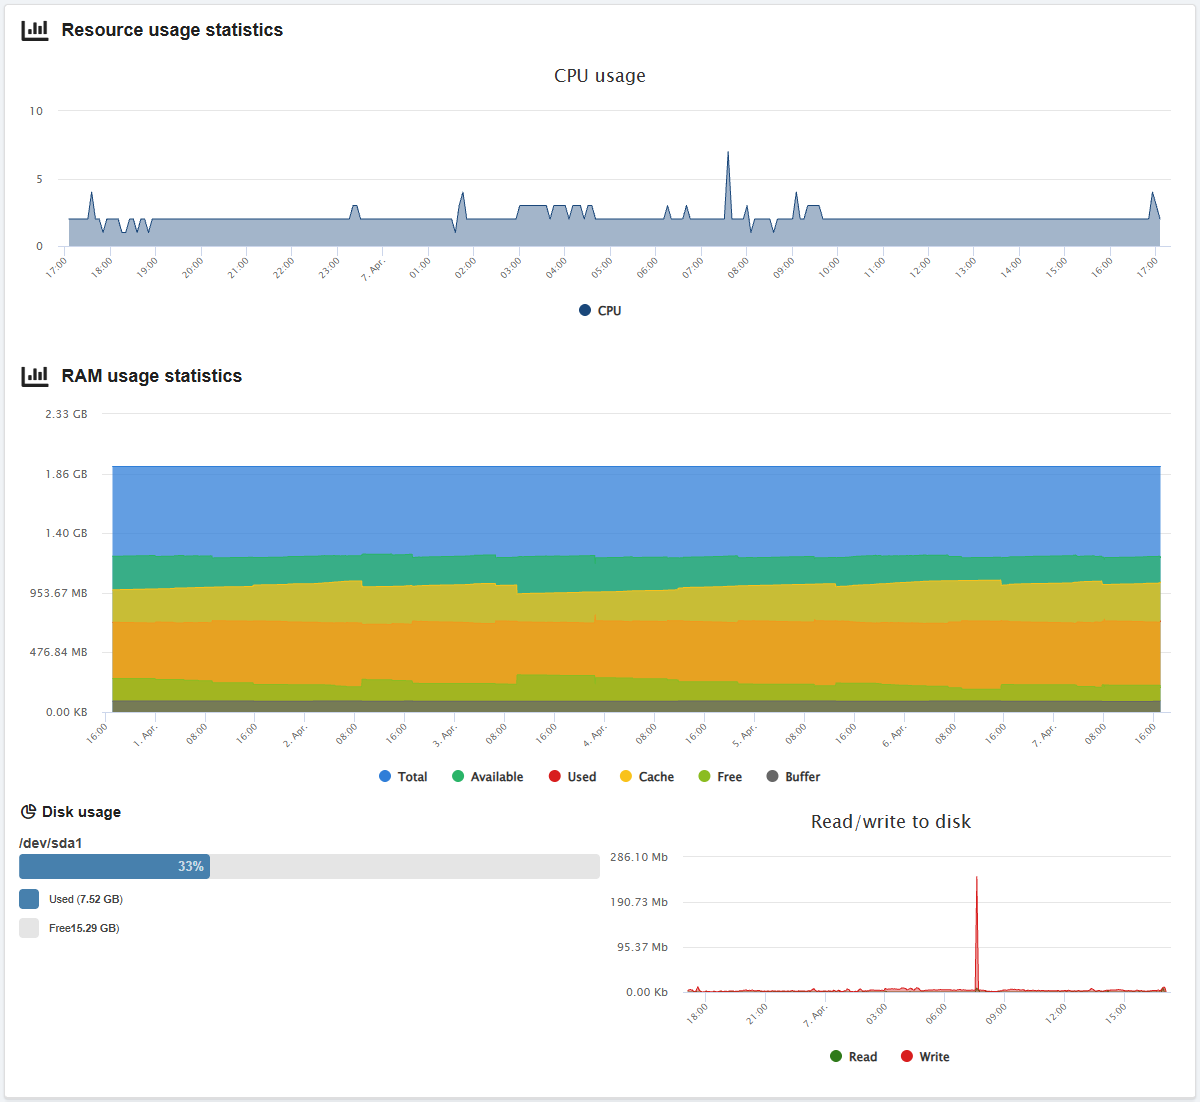
The "Resource usage statistics" block:
- CPU usage — CPU core load statistics (100% — one core, 200% — two cores, etc.) for the last 24 hours.
- RAM usage statistics — statistics on RAM usage over the last 7 days.
- Collected every 5 minutes only for servers with automatically installed Linux OS.
- Not displayed if the OS was installed manually, Windows OS is used, or the system was unable to obtain data for some reason.
- The indicators are similar to the output of the
freecommand:- Total — the amount of available memory (MemTotal and SwapTotal in /proc/meminfo).
- Available — memory available for launching new apps without using swap (MemAvailable in /proc/meminfo).
- Used — memory that is in use or unavailable (total - available)
- Cache — memory used for page caching and slab allocation (Cached and SReclaimable in /proc/meminfo).
- Free — free memory (MemFree and SwapFree in /proc/meminfo).
- Buffers — memory used by kernel buffers (Buffers in /proc/meminfo).
- Disk usage — how much disk space is used and how much is free.
- Read/write to disk — statistics of the amount of data read and written to disk over the last 24 hours.
Traffic
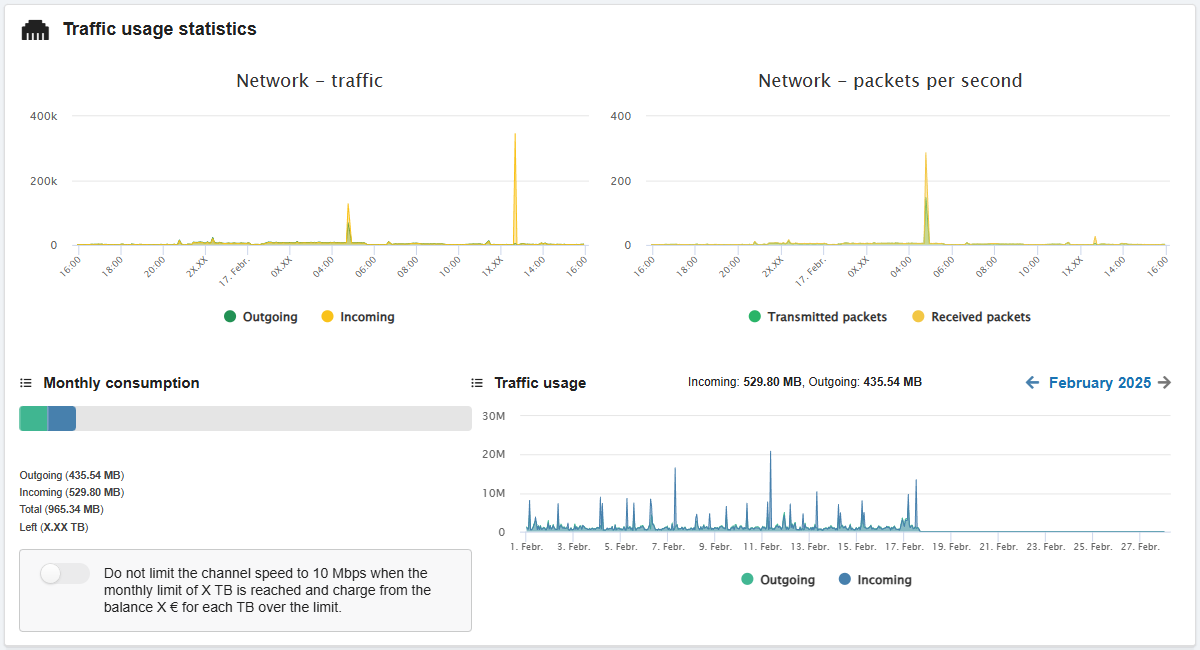
The "Traffic usage statistics" block:
- Network — traffic — statistics of incoming and outgoing traffic amounts for the last 24 hours.
- Network — packets per second — statistics of the number of received and transmitted packets for the last day.
- Monthly consumption — how much incoming and outgoing traffic has been used in the current month and how much is left.
- Traffic usage — statistics of incoming and outgoing traffic by month (stored only for the last 90 days).
The "Do not limit the channel speed" option allows you to keep the channel speed after the standard monthly limit is reached for an extra payment (see Extra traffic for VPS).