Manage cookies that are used for advertising, such as ad personalization, remarketing, and ad effectiveness analysis.
2.6.1.21. MySQL performance log (Performance Schema)
Attention!
For business hosting only.MySQL performance logging allows you to see which queries are executed more often than others, how long it takes to execute each query, connection statistics and memory consumption. This information helps you decide whether it is necessary to optimize the logic of the site's work with the database, cache frequent queries, etc.
The Performance Schema is used for logging. After enabling, query data is collected in the performance_schema service database (it will be visible when connecting to the MySQL server, but is not available for viewing). The obtained information can be viewed on the statistics tab. After the analysis is complete, it is recommended to disable logging so that it does not consume hosting account resources.
Enable and disable
Important points:
- Enable logging only when necessary and disable it as soon as you receive the necessary data. Collecting and saving logs uses disk space, reduces the speed of MySQL queries and increases the CPU and RAM usage of your hosting account, that's why logging is disabled by default and it is not recommended to leave it on for a long time without need.
- Enabling and disabling logging reloads MySQL.
- When MySQL is reloaded, all collected statistics is cleared.
To enable or disable logging, open the "MySQL performance" section and click "Performance Schema" at the top of the page.
View
Notes:
- Query statistics are based on the last 10 thousand rows from the
events_statements_summary_by_digesttable. - The query execution time is displayed in seconds to 4 decimal places.
- When hovering over a column heading, the original name of the parameter is displayed.
To view statistics, open the "MySQL performance" section and switch to the "Performance Schema" tab.
Statistics are displayed in four tabs:
- "Queries" — information about all queries that were executed in the instance (data from the
events_statements_summary_by_digesttable):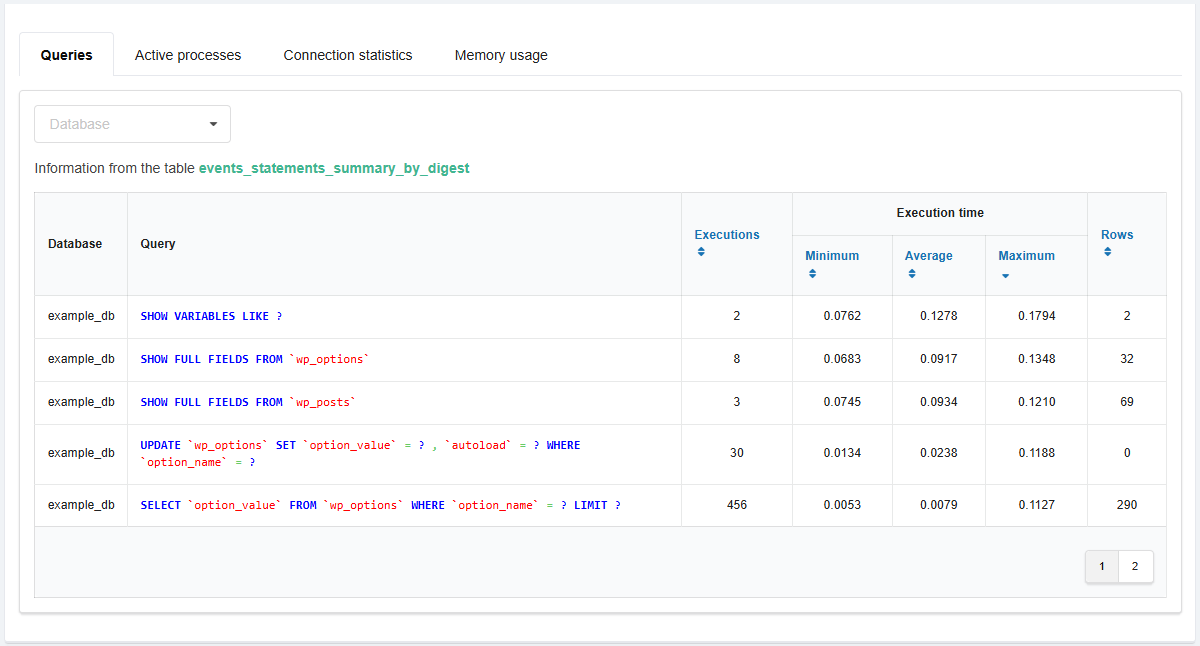
- "Active processes" — information about active processes (data from the
processlisttable):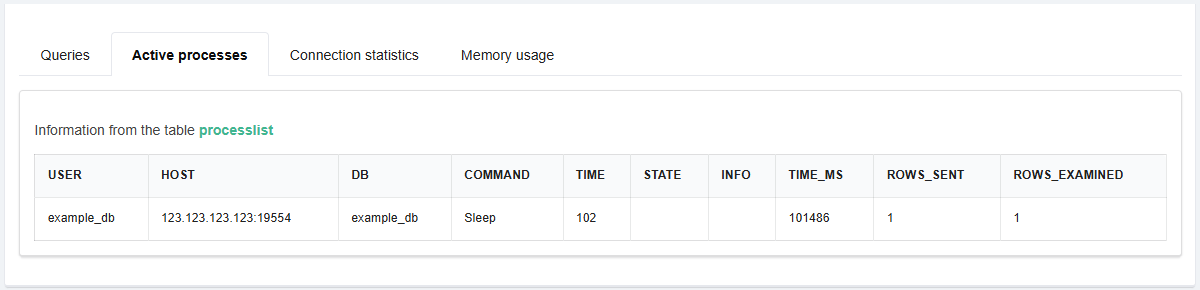
- "Connection statistics" — information about database users' connections (data from the
accountstable):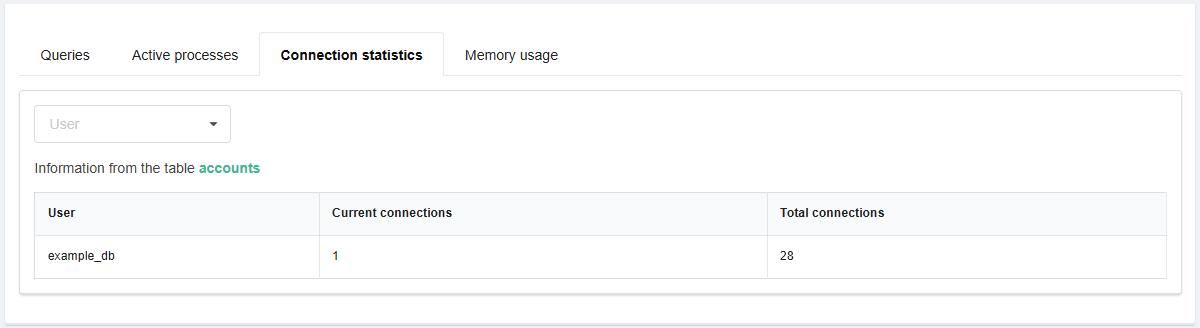
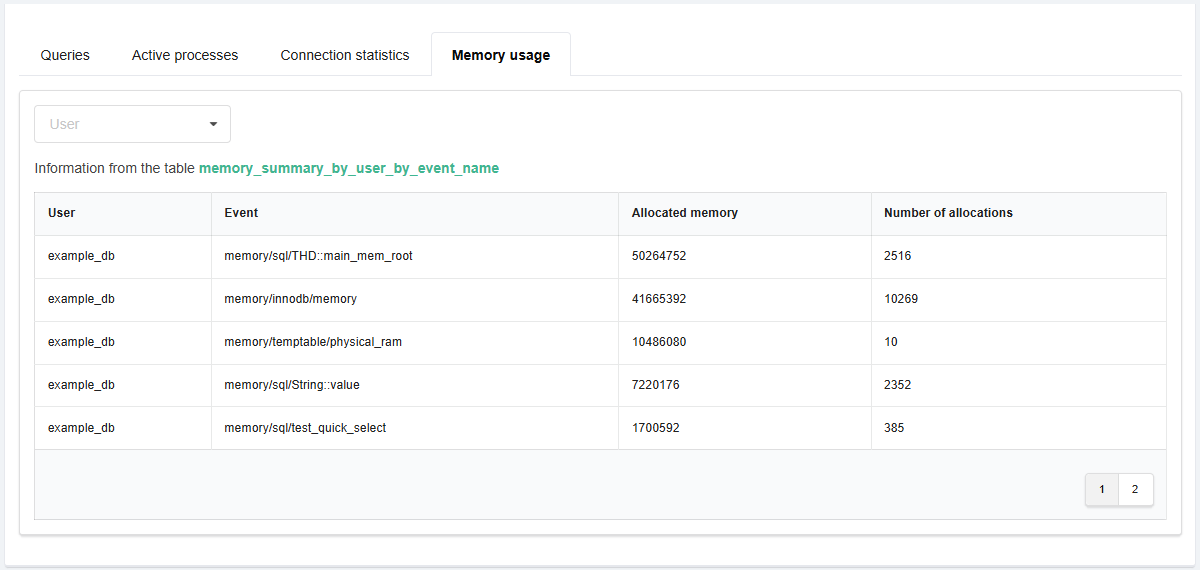
- "Memory usage" — information about memory usage by the processes executed by database users (data from the
memory_summary_by_user_by_event_nametable):