Manage cookies that are used for advertising, such as ad personalization, remarketing, and ad effectiveness analysis.
2.6.1.12. MySQL server load
Information about MySQL server load can be found in the "MySQL server load" section.
Top users
The main block displays the top database users that create load on MySQL server: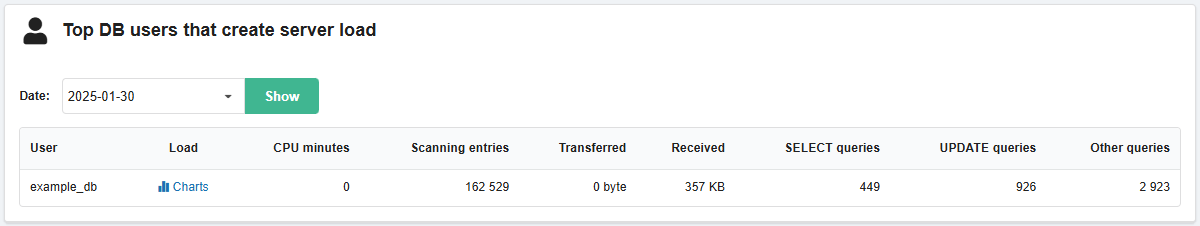
- "Date" — selecting the date for which the statistics will be displayed.
- "User" — database user. To see which databases the user is associated with, see the "Databases" section.
- "Load" — additional information on the load that is created by the database user.
- "CPU minutes" — number of used CPU minutes.
- "Scanning entries" — number of scanned entries.
- "Transferred" — amount of data that was sent to the database server.
- "Received" — amount of data that was received from the database server.
- "SELECT queries", "UPDATE queries", "Other queries" — number of queries the user has sent to the database server.
Charts
You can view statistics for a specific user by clicking the "Charts" button in the top users.
Below the main block, charts with general statistics for all users for the last 30 days are displayed:
- "Processor time, in minutes" — number of used CPU minutes.
- "Duration of base usage per day, %" — percentage of MySQL server usage. The sum of BUSY_TIME values from the beginning of the day is taken, divided by 86400 (the number of seconds in a day) and multiplied by 100 (percent).
- "Database queries" — number of SELECT, UPDATE, COMMIT, ROLLBACK and other queries.
- "Scanning entries" — number of received, updated and read entries.
- "Traffic, in Gb" — amount of data transferred, received and written to binlog.
- "Number of connections" — connection statistics for all users:
- "Total connections" — total number of connections. Each time any database user connects, the counter is incremented by 1. The data is updated every 6 minutes.
- "Concurrent connections" — number of simultaneous connections. It helps to approximately estimate which days had more and which days had fewer simultaneous connections. The counter records the maximum number of simultaneous connections of any database users for every 6 minutes, this value is added to the number of simultaneous connections for the current day, after which the counter is reset and the cycle is repeated.
- "Errors":
- "Denied connections" — the server refused to connect to the client (for example, if the database, user, or password were specified incorrectly).
- "Lost connections" — loss of connection between client and server during query execution (e.g. due to connection timeout when processing too long query, due to network problems, etc.).
- "Access denied" — the client attempted to perform an operation for which it does not have permissions (for example, when attempting to access a database or table without the appropriate privileges).
- "Empty queries" — the client connected to the server, but sent an empty string or an empty query to the server (e.g.,
– sql comment).
(3)